
Automotive retailer Lithia Motors (NYSE: LAD) reported Q3 CY2025 results exceeding the market’s revenue expectations, with sales up 4.9% year on year to $9.68 billion. Its non-GAAP profit of $9.50 per share was 10.4% above analysts’ consensus estimates.
Is now the time to buy Lithia? Find out by accessing our full research report, it’s free for active Edge members.
Lithia (LAD) Q3 CY2025 Highlights:
- Revenue: $9.68 billion vs analyst estimates of $9.43 billion (4.9% year-on-year growth, 2.6% beat)
- Adjusted EPS: $9.50 vs analyst estimates of $8.61 (10.4% beat)
- Adjusted EBITDA: $438 million vs analyst estimates of $441.3 million (4.5% margin, 0.7% miss)
- Operating Margin: 4.4%, in line with the same quarter last year
- Free Cash Flow was -$207.3 million, down from $157.1 million in the same quarter last year
- Same-Store Sales rose 7.7% year on year (-6.2% in the same quarter last year)
- Market Capitalization: $8.00 billion
"Our third quarter results demonstrate our focus on operational excellence with strong growth in same store sales and earnings per share and solid profitability gains driven by the continued execution of our strategy" said Bryan DeBoer, President and CEO.
Company Overview
With a strong presence in the Western US, Lithia Motors (NYSE: LAD) sells a wide range of vehicles, including new and used cars, trucks, SUVs, and luxury vehicles from various manufacturers.
Revenue Growth
A company’s long-term performance is an indicator of its overall quality. Any business can have short-term success, but a top-tier one grows for years.
With $37.66 billion in revenue over the past 12 months, Lithia is one of the larger companies in the consumer retail industry and benefits from a well-known brand that influences purchasing decisions.
As you can see below, Lithia grew its sales at an exceptional 20.4% compounded annual growth rate over the last six years (we compare to 2019 to normalize for COVID-19 impacts) as it opened new stores and expanded its reach.
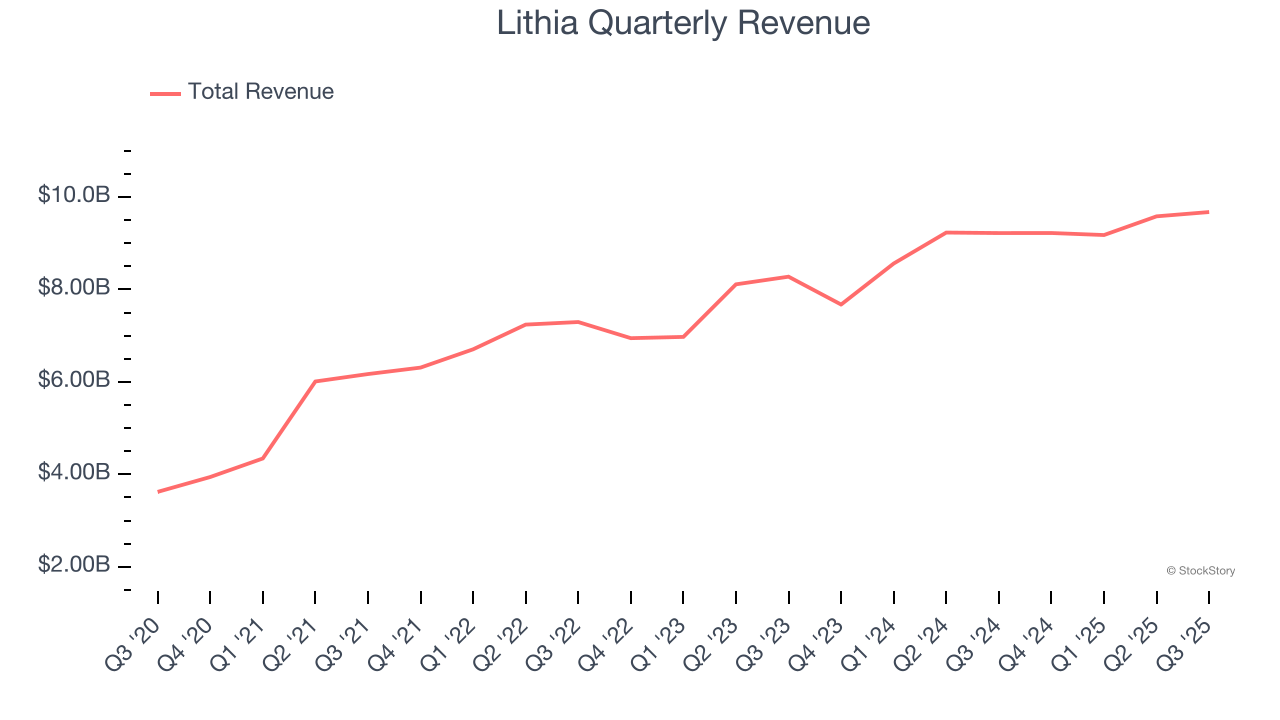
This quarter, Lithia reported modest year-on-year revenue growth of 4.9% but beat Wall Street’s estimates by 2.6%.
Looking ahead, sell-side analysts expect revenue to grow 1.4% over the next 12 months, a deceleration versus the last six years. This projection doesn't excite us and implies its products will face some demand challenges.
Today’s young investors won’t have read the timeless lessons in Gorilla Game: Picking Winners In High Technology because it was written more than 20 years ago when Microsoft and Apple were first establishing their supremacy. But if we apply the same principles, then enterprise software stocks leveraging their own generative AI capabilities may well be the Gorillas of the future. So, in that spirit, we are excited to present our Special Free Report on a profitable, fast-growing enterprise software stock that is already riding the automation wave and looking to catch the generative AI next.
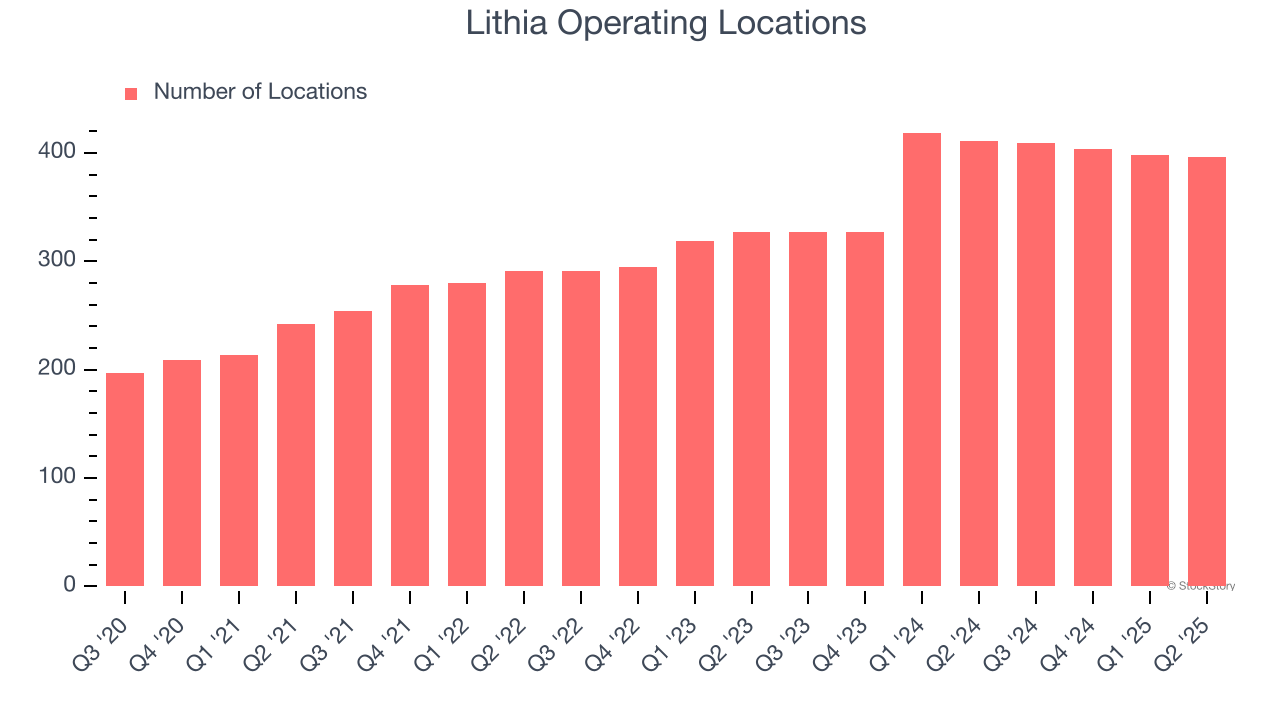
Store Performance
Number of Stores
The number of stores a retailer operates is a critical driver of how quickly company-level sales can grow.
Lithia opened new stores at a rapid clip over the last two years, averaging 15.4% annual growth, much faster than the broader consumer retail sector.
When a retailer opens new stores, it usually means it’s investing for growth because demand is greater than supply, especially in areas where consumers may not have a store within reasonable driving distance.
Note that Lithia reports its store count intermittently, so some data points are missing in the chart below.
Same-Store Sales
A company's store base only paints one part of the picture. When demand is high, it makes sense to open more. But when demand is low, it’s prudent to close some locations and use the money in other ways. Same-store sales is an industry measure of whether revenue is growing at those existing stores and is driven by customer visits (often called traffic) and the average spending per customer (ticket).
Lithia’s demand within its existing locations has barely increased over the last two years as its same-store sales were flat. Lithia should consider improving its foot traffic and efficiency before expanding its store base.
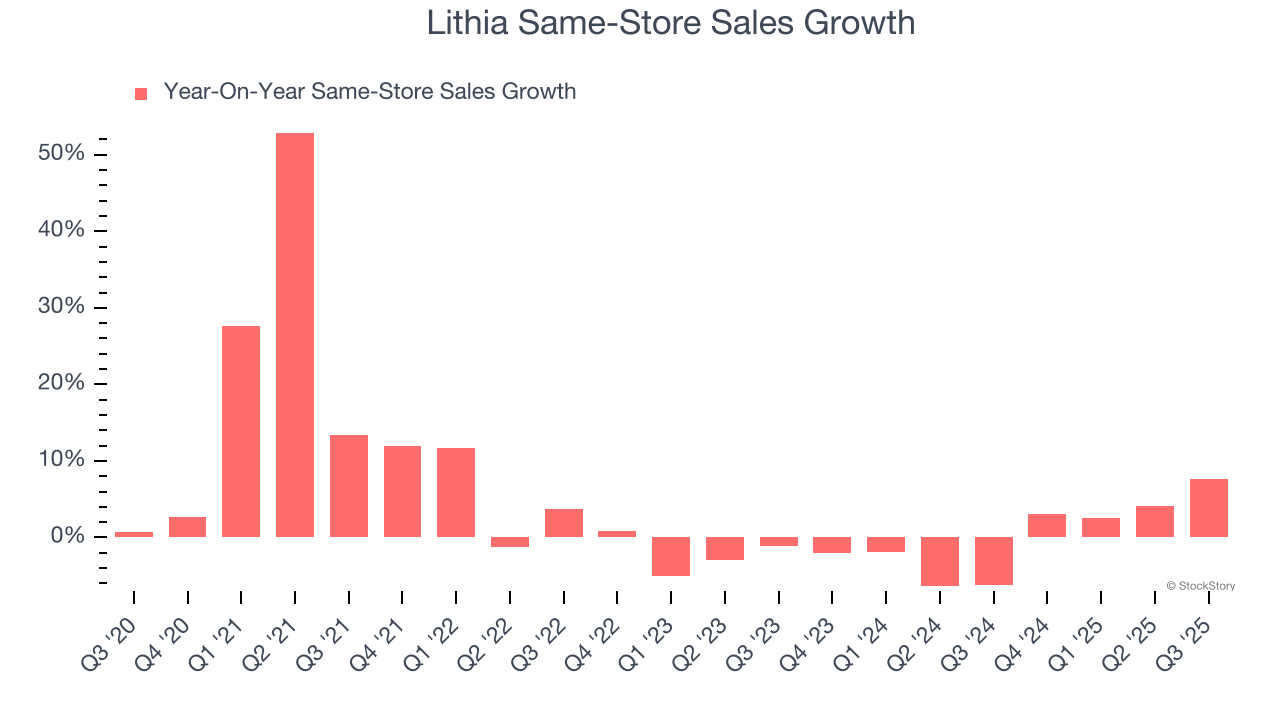
In the latest quarter, Lithia’s same-store sales rose 7.7% year on year. This growth was an acceleration from its historical levels, which is always an encouraging sign.
Key Takeaways from Lithia’s Q3 Results
We enjoyed seeing Lithia beat analysts’ revenue expectations this quarter. We were also glad its EPS outperformed Wall Street’s estimates. On the other hand, its gross margin slightly missed and its EBITDA fell slightly short of Wall Street’s estimates. Overall, this print was mixed but still had some key positives. The stock remained flat at $314 immediately after reporting.
Sure, Lithia had a solid quarter, but if we look at the bigger picture, is this stock a buy? What happened in the latest quarter matters, but not as much as longer-term business quality and valuation, when deciding whether to invest in this stock. We cover that in our actionable full research report which you can read here, it’s free for active Edge members.


