
Digital small business lender Live Oak Bancshares (NYSE: LOB) met Wall Street’s revenue expectations in Q3 CY2025, with sales up 12.4% year on year to $146.1 million. Its GAAP profit of $0.55 per share was 6.8% below analysts’ consensus estimates.
Is now the time to buy Live Oak Bancshares? Find out by accessing our full research report, it’s free for active Edge members.
Live Oak Bancshares (LOB) Q3 CY2025 Highlights:
- Net Interest Income: $115.5 million vs analyst estimates of $112.8 million (19.1% year-on-year growth, 2.4% beat)
- Net Interest Margin: 3.3% vs analyst estimates of 3.3% (2.3 basis point beat)
- Revenue: $146.1 million vs analyst estimates of $146.6 million (12.4% year-on-year growth, in line)
- Efficiency Ratio: 59.7% vs analyst estimates of 58.6% (117.3 basis point miss)
- EPS (GAAP): $0.55 vs analyst expectations of $0.59 (6.8% miss)
- Tangible Book Value per Share: $23.96 vs analyst estimates of $23.84 (7.4% year-on-year growth, 0.5% beat)
- Market Capitalization: $1.59 billion
“Live Oak’s third quarter results reflect the strength of our core banking operations and our continued commitment to serving small businesses across the country. We delivered strong loan production, were again named the SBA’s leading 7(a) lender by dollar amount, had significant deposit growth, and drove total assets to $14.67 billion—a 16% increase year-over-year,” said Live Oak Chairman and CEO James S. (Chip) Mahan III.
Company Overview
Founded during the 2008 financial crisis with a vision to reimagine small business banking through technology, Live Oak Bancshares (NYSE: LOB) is a bank holding company that specializes in providing online banking services and SBA-guaranteed loans to small businesses across targeted industries nationwide.
Sales Growth
Two primary revenue streams drive bank earnings. While net interest income, which is earned by charging higher rates on loans than paid on deposits, forms the foundation, fee-based services across banking, credit, wealth management, and trading operations provide additional income. Over the last five years, Live Oak Bancshares grew its revenue at an incredible 15.4% compounded annual growth rate. Its growth surpassed the average banking company and shows its offerings resonate with customers, a great starting point for our analysis.
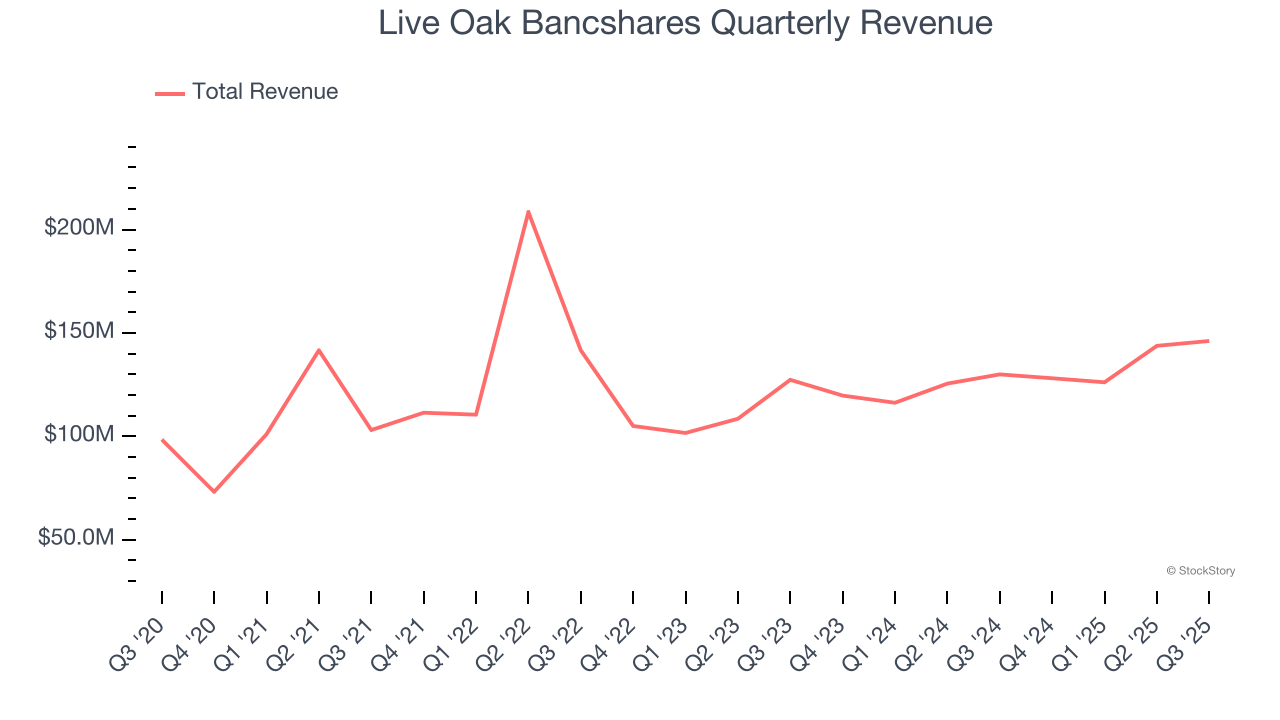
We at StockStory place the most emphasis on long-term growth, but within financials, a half-decade historical view may miss recent interest rate changes, market returns, and industry trends. Live Oak Bancshares’s annualized revenue growth of 10.9% over the last two years is below its five-year trend, but we still think the results suggest healthy demand. 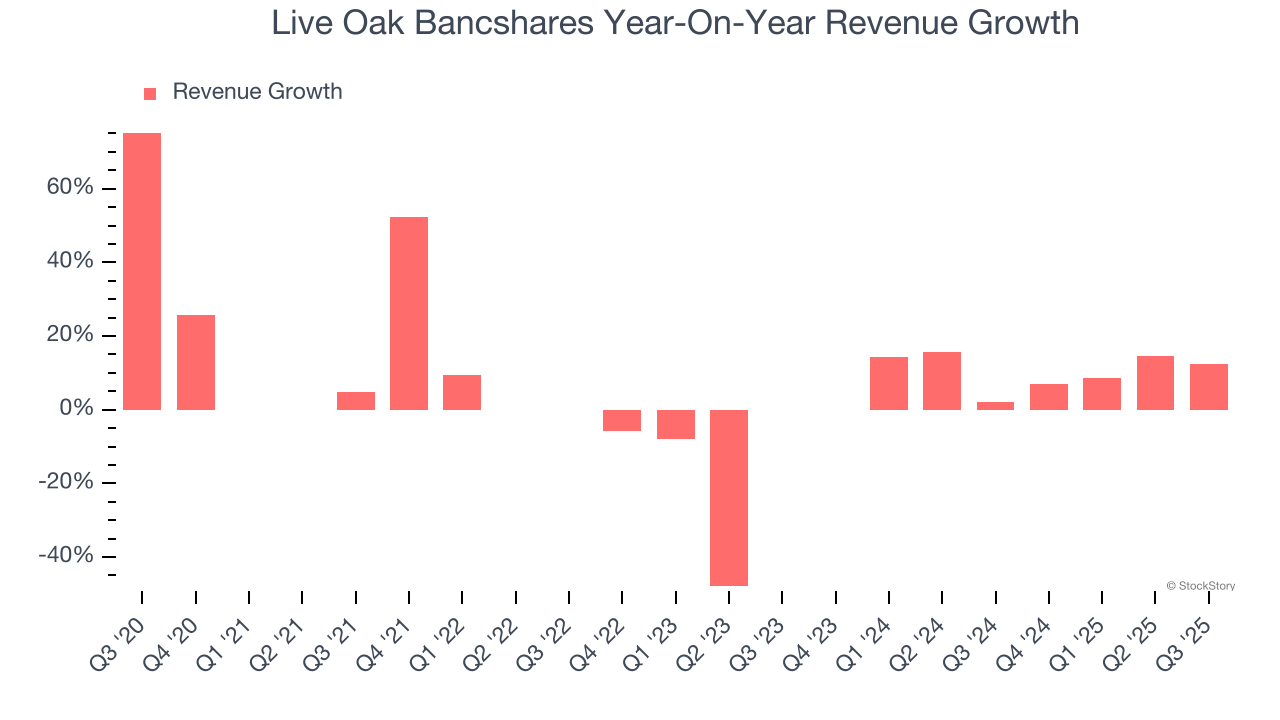 Note: Quarters not shown were determined to be outliers, impacted by outsized investment gains/losses that are not indicative of the recurring fundamentals of the business.
This quarter, Live Oak Bancshares’s year-on-year revenue growth was 12.4%, and its $146.1 million of revenue was in line with Wall Street’s estimates.
Net interest income made up 72% of the company’s total revenue during the last five years, meaning lending operations are Live Oak Bancshares’s largest source of revenue.
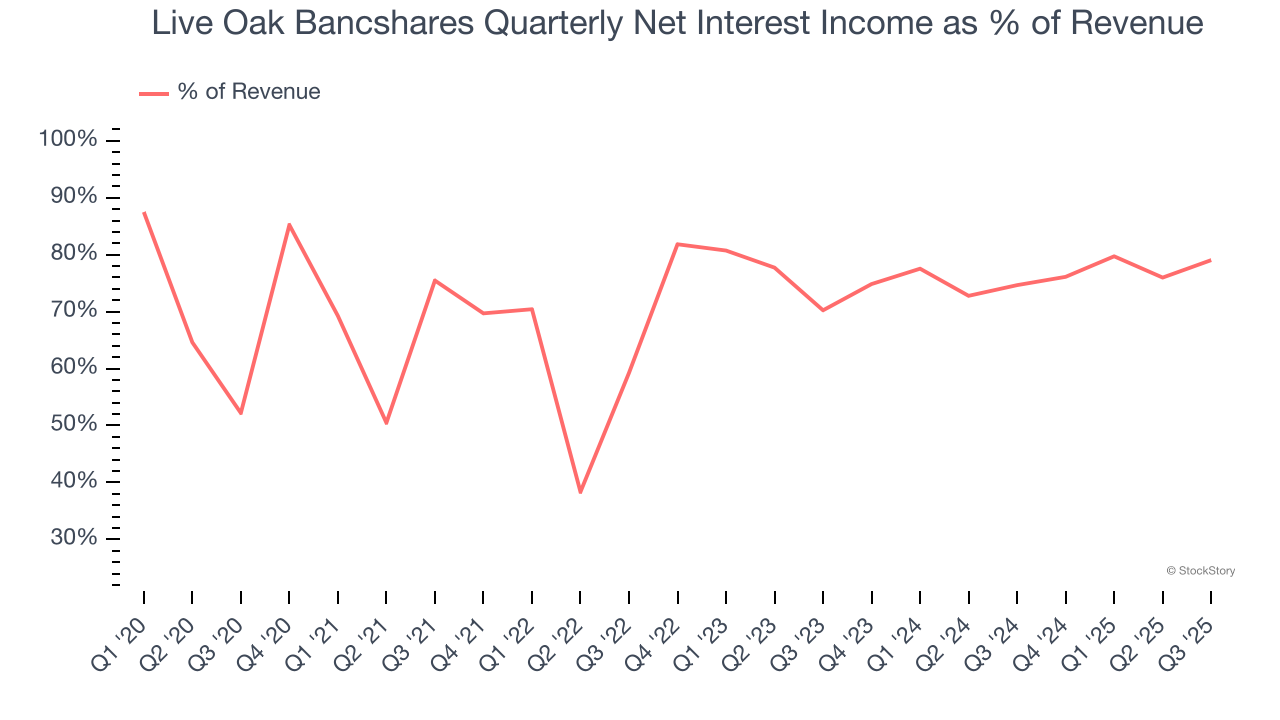
Net interest income commands greater market attention due to its reliability and consistency, whereas non-interest income is often seen as lower-quality revenue that lacks the same dependable characteristics.
Unless you’ve been living under a rock, it should be obvious by now that generative AI is going to have a huge impact on how large corporations do business. While Nvidia and AMD are trading close to all-time highs, we prefer a lesser-known (but still profitable) stock benefiting from the rise of AI. Click here to access our free report one of our favorites growth stories.
Tangible Book Value Per Share (TBVPS)
Banks profit by intermediating between depositors and borrowers, making them fundamentally balance sheet-driven enterprises. Market participants emphasize balance sheet quality and sustained book value growth when evaluating these institutions.
When analyzing banks, tangible book value per share (TBVPS) takes precedence over many other metrics. This measure isolates genuine per-share value by removing intangible assets of debatable liquidation worth. EPS can become murky due to acquisition impacts or accounting flexibility around loan provisions, and TBVPS resists financial engineering manipulation.
Live Oak Bancshares’s TBVPS grew at an incredible 10.7% annual clip over the last five years. TBVPS growth has also accelerated recently, growing by 11.9% annually over the last two years from $19.12 to $23.96 per share.
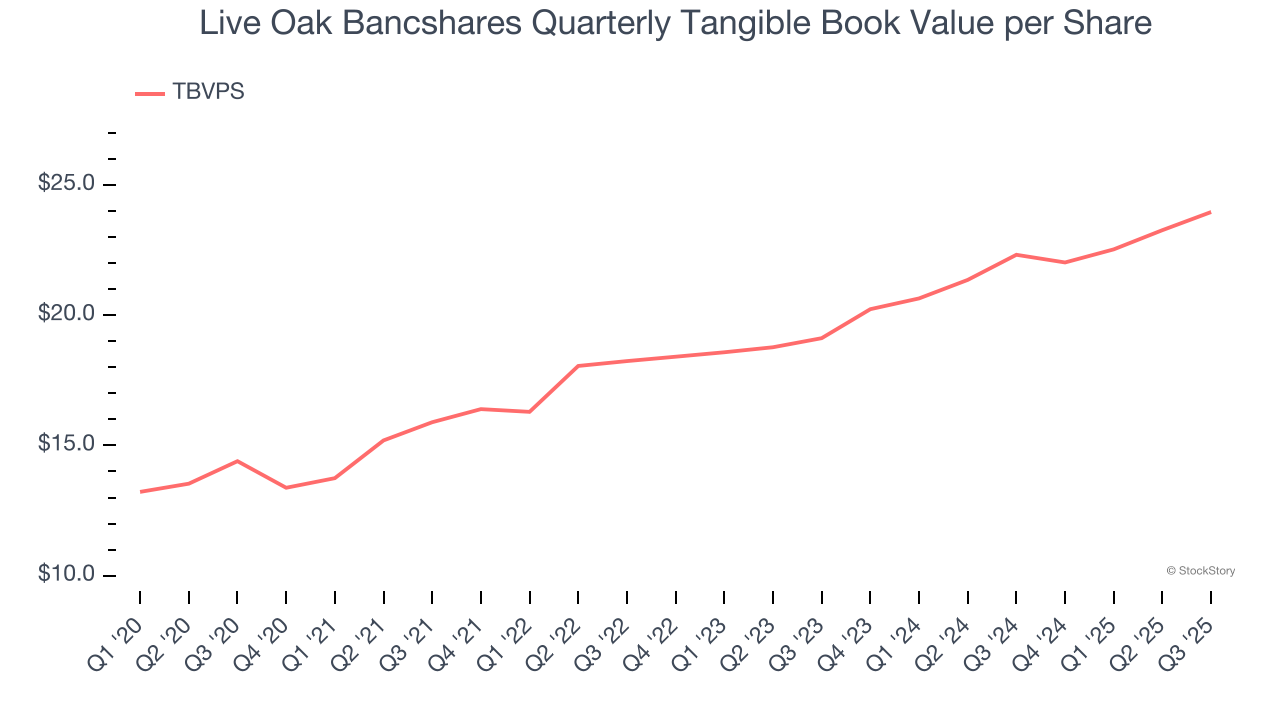
Over the next 12 months, Consensus estimates call for Live Oak Bancshares’s TBVPS to grow by 11.7% to $26.76, top-notch growth rate.
Key Takeaways from Live Oak Bancshares’s Q3 Results
It was encouraging to see Live Oak Bancshares beat analysts’ net interest income expectations this quarter. We were also happy its tangible book value per share narrowly outperformed Wall Street’s estimates. On the other hand, its EPS missed Wall Street’s estimates. Overall, this was a mixed quarter. The stock remained flat at $34.65 immediately following the results.
Live Oak Bancshares didn’t show it’s best hand this quarter, but does that create an opportunity to buy the stock right now? If you’re making that decision, you should consider the bigger picture of valuation, business qualities, as well as the latest earnings. We cover that in our actionable full research report which you can read here, it’s free for active Edge members.