
Midwestern regional bank Old National Bancorp (NASDAQ: ONB) reported Q3 CY2025 results beating Wall Street’s revenue expectations, with sales up 46.8% year on year to $713 million. Its non-GAAP profit of $0.59 per share was 5.1% above analysts’ consensus estimates.
Is now the time to buy Old National Bank? Find out by accessing our full research report, it’s free for active Edge members.
Old National Bank (ONB) Q3 CY2025 Highlights:
- Net Interest Income: $574.6 million vs analyst estimates of $577.3 million (46.7% year-on-year growth, in line)
- Net Interest Margin: 3.6% vs analyst estimates of 3.6% (5.5 basis point beat)
- Revenue: $713 million vs analyst estimates of $690.9 million (46.8% year-on-year growth, 3.2% beat)
- Efficiency Ratio: 58.8% vs analyst estimates of 51.6% (718.6 basis point miss)
- Adjusted EPS: $0.59 vs analyst estimates of $0.56 (5.1% beat)
- Tangible Book Value per Share: $13.15 vs analyst estimates of $13.01 (9.5% year-on-year growth, 1% beat)
- Market Capitalization: $8.10 billion
"Old National's outstanding quarterly results reflect our continued focus on the fundamentals and the benefits from our recent partnership with Bremer Bank," said Chairman and CEO Jim Ryan.
Company Overview
Tracing its roots back to 1834 when Andrew Jackson was president, Old National Bancorp (NASDAQ: ONB) is a bank holding company that provides commercial and consumer loans, deposit services, wealth management, and treasury solutions primarily throughout the Midwest region.
Sales Growth
From lending activities to service fees, most banks build their revenue model around two income sources. Interest rate spreads between loans and deposits create the first stream, with the second coming from charges on everything from basic bank accounts to complex investment banking transactions. Luckily, Old National Bank’s revenue grew at an incredible 23.5% compounded annual growth rate over the last five years. Its growth surpassed the average banking company and shows its offerings resonate with customers, a great starting point for our analysis.
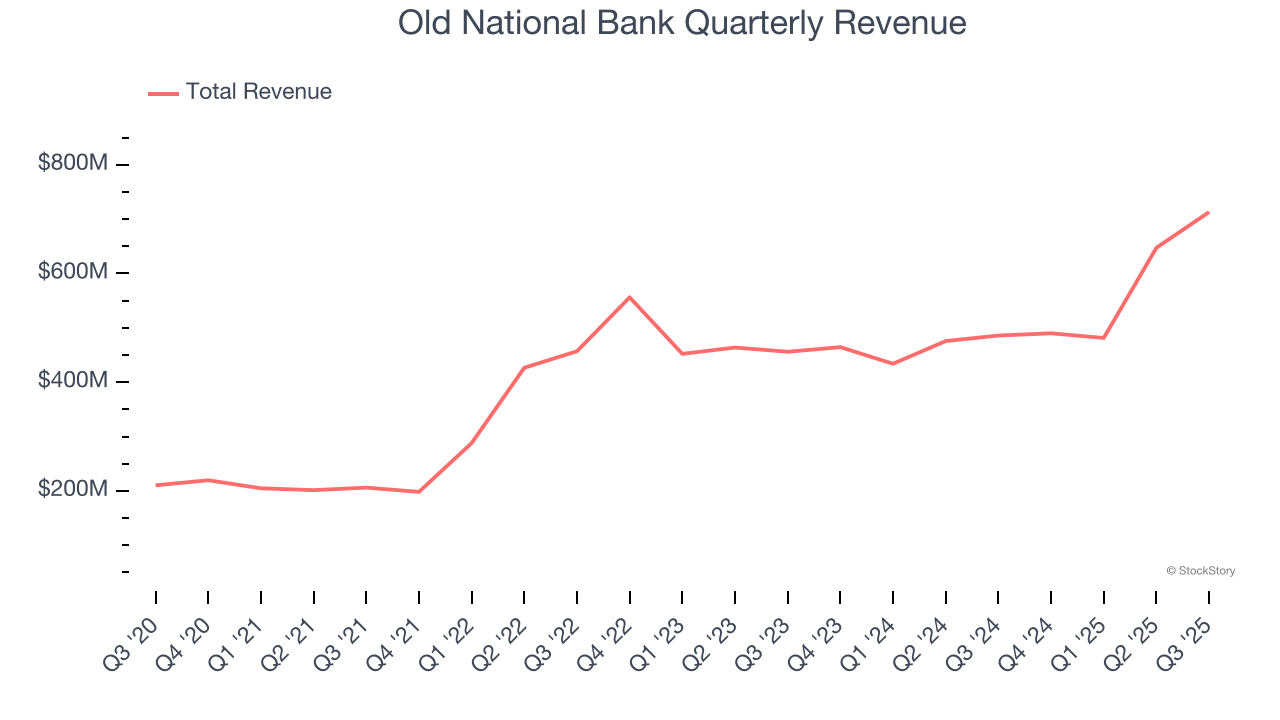
Long-term growth is the most important, but within financials, a half-decade historical view may miss recent interest rate changes and market returns. Old National Bank’s annualized revenue growth of 10% over the last two years is below its five-year trend, but we still think the results suggest healthy demand. 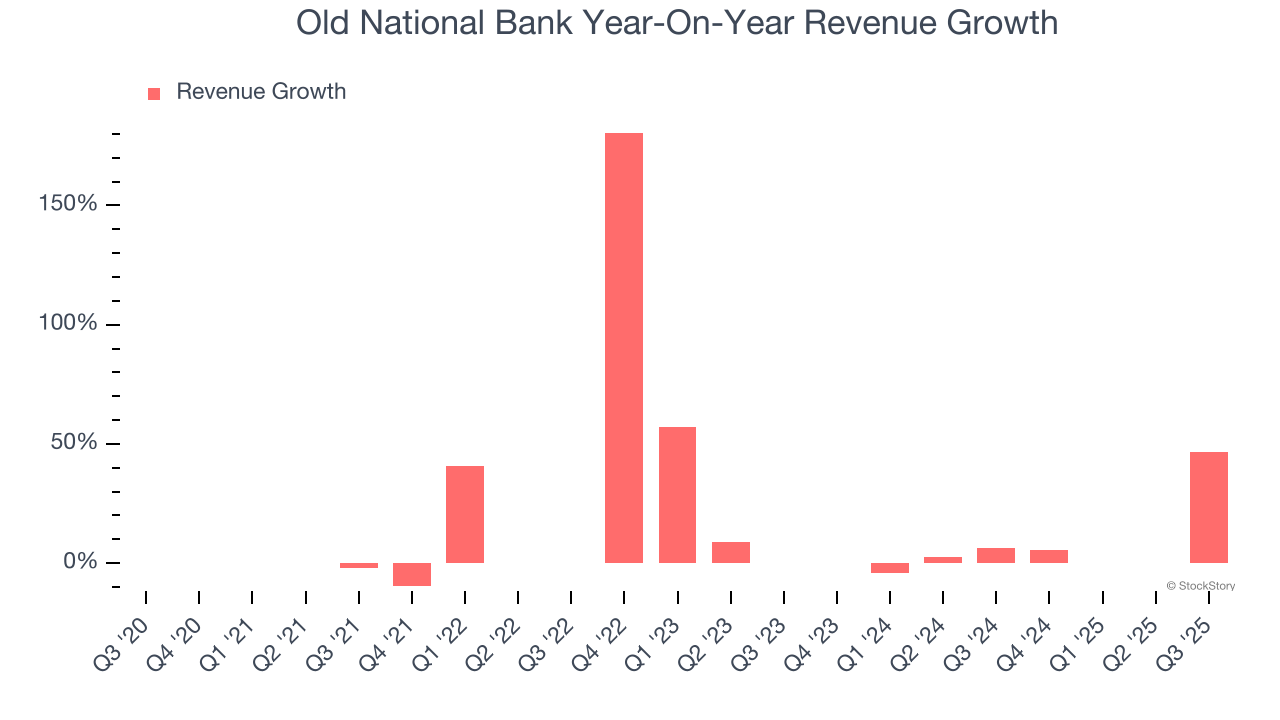 Note: Quarters not shown were determined to be outliers, impacted by outsized investment gains/losses that are not indicative of the recurring fundamentals of the business.
This quarter, Old National Bank reported magnificent year-on-year revenue growth of 46.8%, and its $713 million of revenue beat Wall Street’s estimates by 3.2%.
Net interest income made up 78.5% of the company’s total revenue during the last five years, meaning lending operations are Old National Bank’s largest source of revenue.
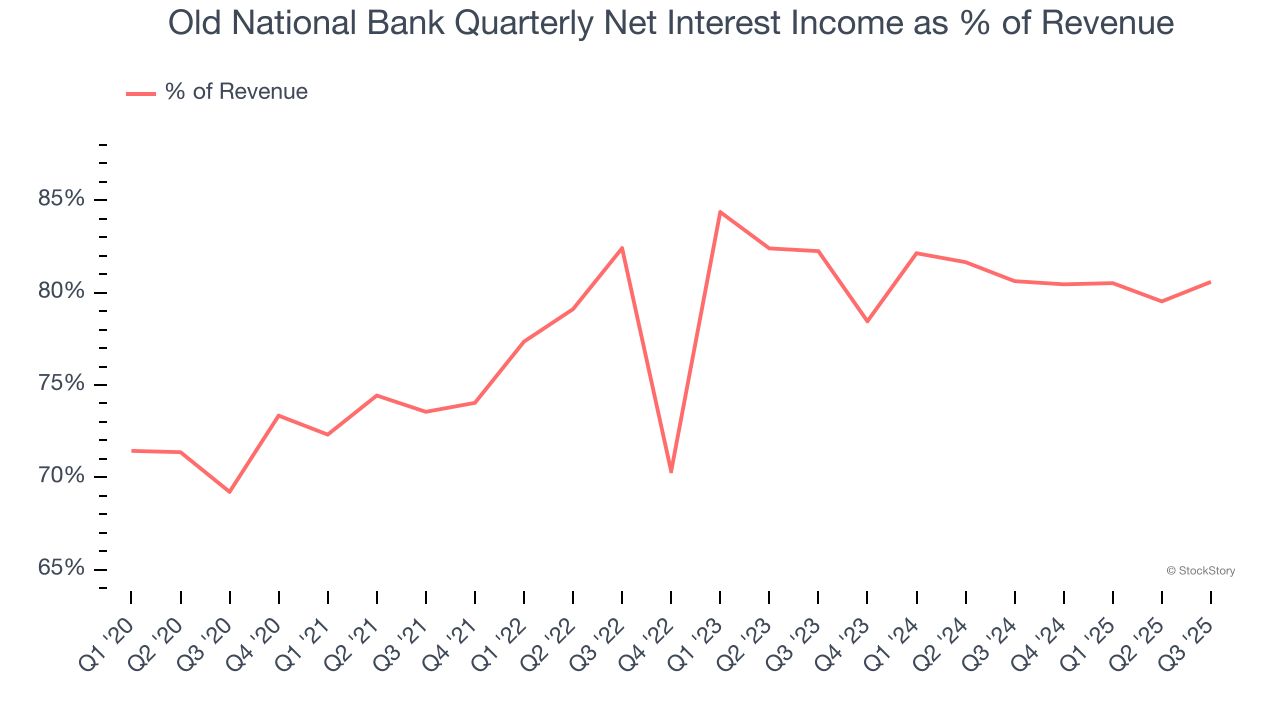
Our experience and research show the market cares primarily about a bank’s net interest income growth as non-interest income is considered a lower-quality and non-recurring revenue source.
Unless you’ve been living under a rock, it should be obvious by now that generative AI is going to have a huge impact on how large corporations do business. While Nvidia and AMD are trading close to all-time highs, we prefer a lesser-known (but still profitable) stock benefiting from the rise of AI. Click here to access our free report one of our favorites growth stories.
Tangible Book Value Per Share (TBVPS)
Banks are balance sheet-driven businesses because they generate earnings primarily through borrowing and lending. They’re also valued based on their balance sheet strength and ability to compound book value (another name for shareholders’ equity) over time.
When analyzing banks, tangible book value per share (TBVPS) takes precedence over many other metrics. This measure isolates genuine per-share value by removing intangible assets of debatable liquidation worth. On the other hand, EPS is often distorted by mergers and flexible loan loss accounting. TBVPS provides clearer performance insights.
Old National Bank’s TBVPS grew at a tepid 3.5% annual clip over the last five years. However, TBVPS growth has accelerated recently, growing by 15.1% annually over the last two years from $9.92 to $13.15 per share.
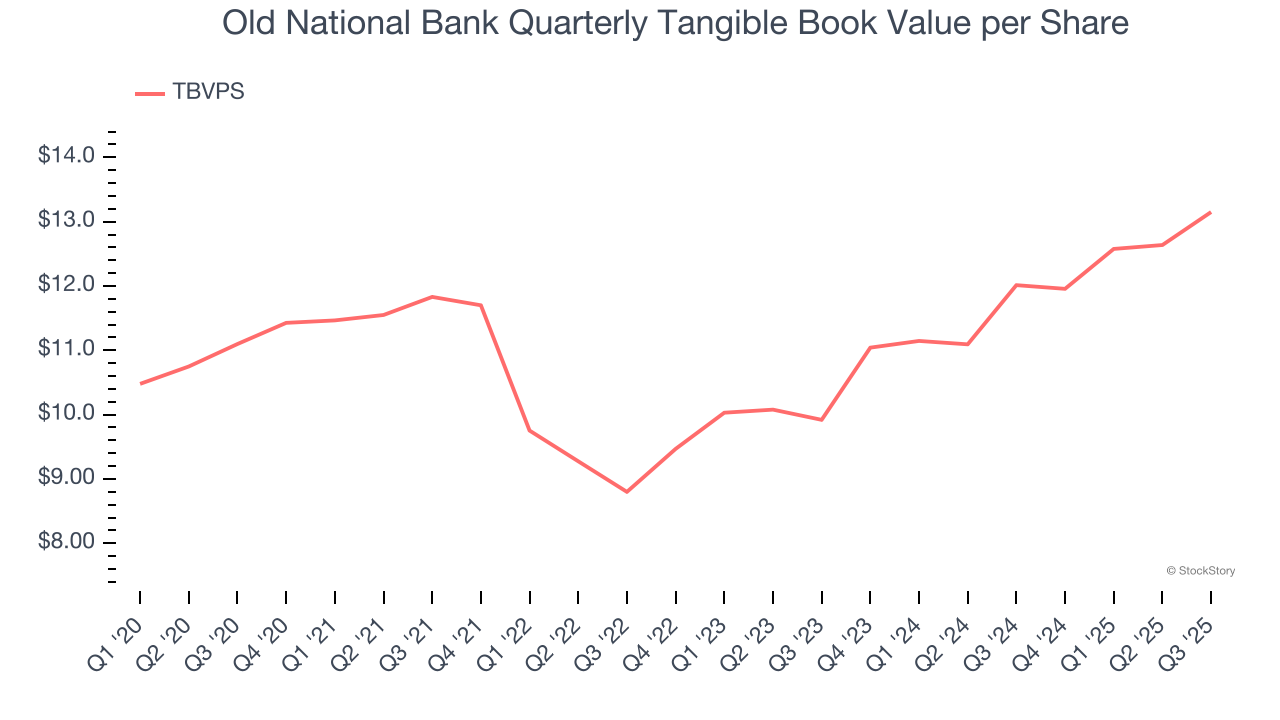
Over the next 12 months, Consensus estimates call for Old National Bank’s TBVPS to grow by 14.4% to $15.04, top-notch growth rate.
Key Takeaways from Old National Bank’s Q3 Results
We enjoyed seeing Old National Bank beat analysts’ revenue expectations this quarter. We were also happy its tangible book value per share narrowly outperformed Wall Street’s estimates. On the other hand, its net interest income was in line. Overall, this print had some key positives. The stock remained flat at $20.86 immediately following the results.
Should you buy the stock or not? If you’re making that decision, you should consider the bigger picture of valuation, business qualities, as well as the latest earnings. We cover that in our actionable full research report which you can read here, it’s free for active Edge members.