Regional banking company Origin Bancorp (NYSE: OBK) announced better-than-expected revenue in Q3 CY2025, with sales up 21% year on year to $109.8 million. Its non-GAAP loss of $0.59 per share was significantly below analysts’ consensus estimates.
Is now the time to buy Origin Bancorp? Find out by accessing our full research report, it’s free for active Edge members.
Origin Bancorp (OBK) Q3 CY2025 Highlights:
- Net Interest Income: $83.7 million vs analyst estimates of $83.81 million (11.9% year-on-year growth, in line)
- Net Interest Margin: 3.7% vs analyst estimates of 3.6% (in line)
- Revenue: $109.8 million vs analyst estimates of $102.1 million (21% year-on-year growth, 7.6% beat)
- Efficiency Ratio: 56.5% vs analyst estimates of 60.9% (442.8 basis point beat)
- Adjusted EPS: -$0.59 vs analyst estimates of $0.69 (significant miss)
- Tangible Book Value per Share: $33.95 vs analyst estimates of $33.97 (8.2% year-on-year growth, in line)
- Market Capitalization: $1.07 billion
Company Overview
Founded in 1912 during the early boom days of Louisiana banking, Origin Bancorp (NYSE: OBK) is a financial holding company that provides personalized banking services to businesses, municipalities, and individuals across Texas, Louisiana, and Mississippi.
Sales Growth
From lending activities to service fees, most banks build their revenue model around two income sources. Interest rate spreads between loans and deposits create the first stream, with the second coming from charges on everything from basic bank accounts to complex investment banking transactions. Luckily, Origin Bancorp’s revenue grew at a solid 8.4% compounded annual growth rate over the last five years. Its growth beat the average banking company and shows its offerings resonate with customers.
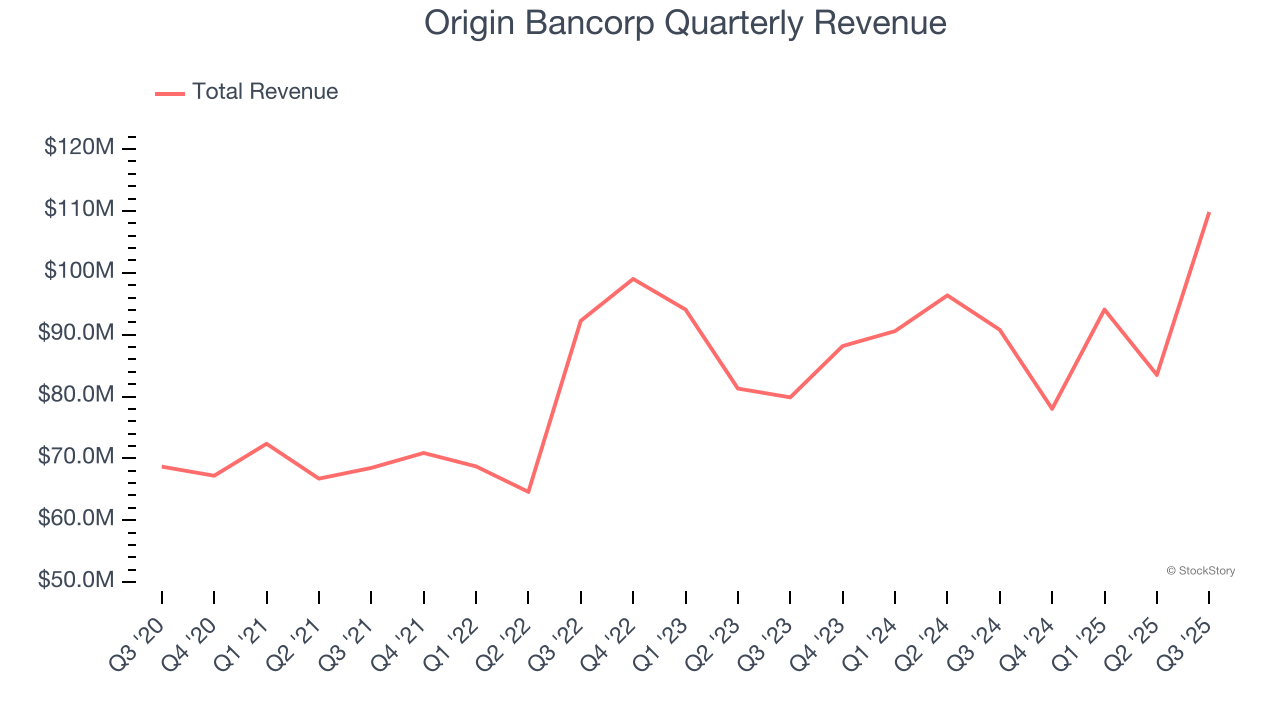
We at StockStory place the most emphasis on long-term growth, but within financials, a half-decade historical view may miss recent interest rate changes, market returns, and industry trends. Origin Bancorp’s recent performance shows its demand has slowed as its annualized revenue growth of 1.6% over the last two years was below its five-year trend. 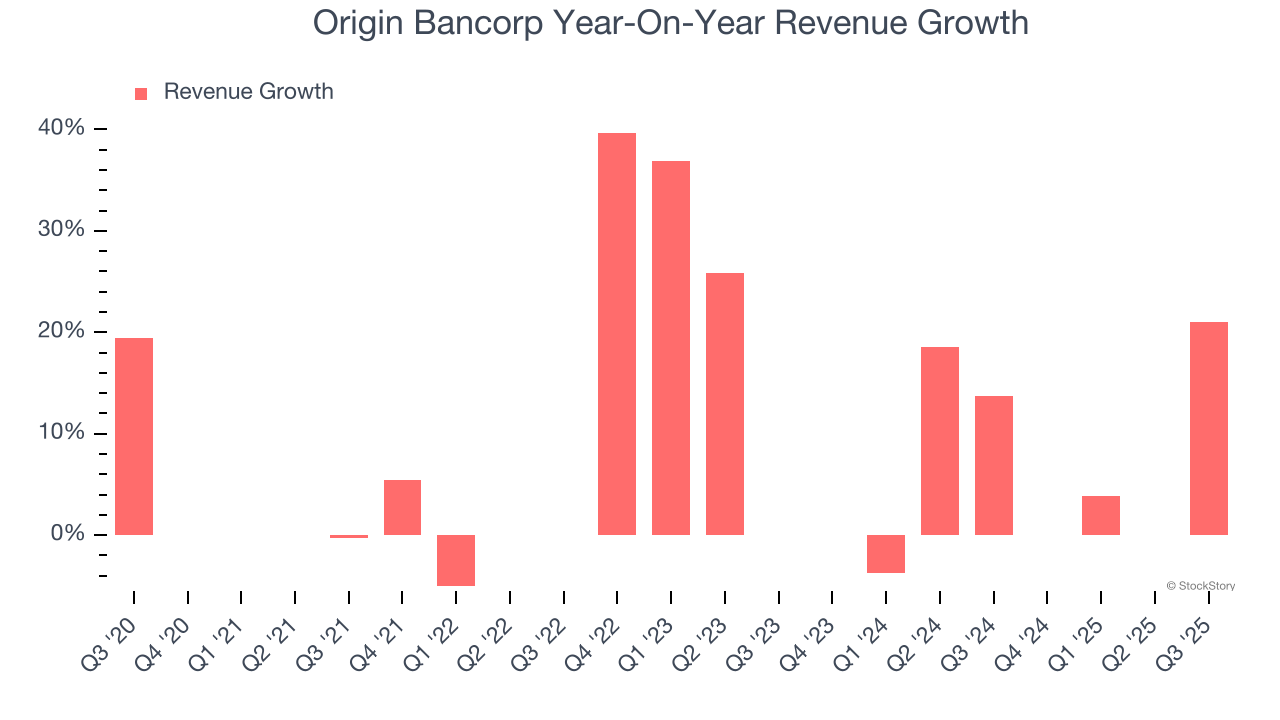 Note: Quarters not shown were determined to be outliers, impacted by outsized investment gains/losses that are not indicative of the recurring fundamentals of the business.
This quarter, Origin Bancorp reported robust year-on-year revenue growth of 21%, and its $109.8 million of revenue topped Wall Street estimates by 7.6%.
Net interest income made up 83.8% of the company’s total revenue during the last five years, meaning Origin Bancorp barely relies on non-interest income to drive its overall growth.
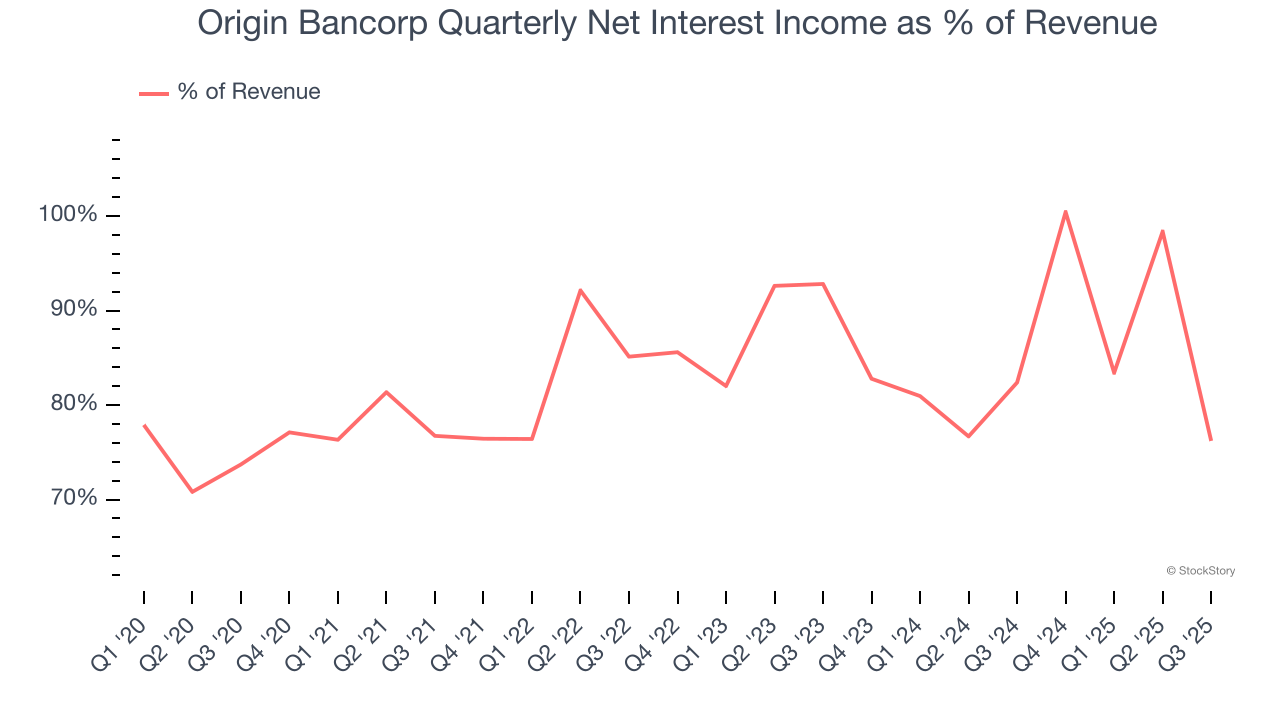
Our experience and research show the market cares primarily about a bank’s net interest income growth as non-interest income is considered a lower-quality and non-recurring revenue source.
Here at StockStory, we certainly understand the potential of thematic investing. Diverse winners from Microsoft (MSFT) to Alphabet (GOOG), Coca-Cola (KO) to Monster Beverage (MNST) could all have been identified as promising growth stories with a megatrend driving the growth. So, in that spirit, we’ve identified a relatively under-the-radar profitable growth stock benefiting from the rise of AI, available to you FREE via this link.
Tangible Book Value Per Share (TBVPS)
The balance sheet drives banking profitability since earnings flow from the spread between borrowing and lending rates. As such, valuations for these companies concentrate on capital strength and sustainable equity accumulation potential.
Because of this, tangible book value per share (TBVPS) emerges as the critical performance benchmark. By excluding intangible assets with uncertain liquidation values, this metric captures real, liquid net worth per share. On the other hand, EPS is often distorted by mergers and flexible loan loss accounting. TBVPS provides clearer performance insights.
Origin Bancorp’s TBVPS grew at a decent 6% annual clip over the last five years. TBVPS growth has accelerated recently, growing by 12.6% annually over the last two years from $26.78 to $33.95 per share.
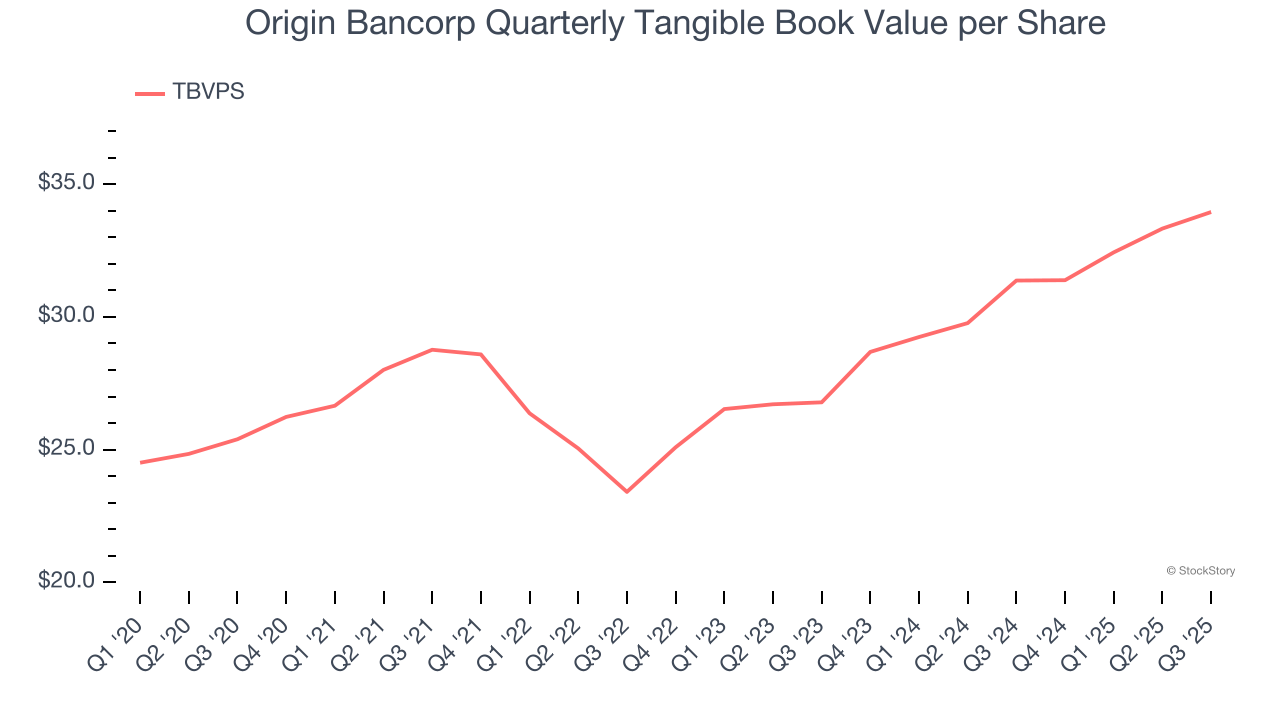
Over the next 12 months, Consensus estimates call for Origin Bancorp’s TBVPS to grow by 9.3% to $37.11, decent growth rate.
Key Takeaways from Origin Bancorp’s Q3 Results
We were impressed by how significantly Origin Bancorp blew past analysts’ revenue expectations this quarter. On the other hand, its EPS missed. Overall, this was a softer quarter. The stock remained flat at $34.36 immediately following the results.
So do we think Origin Bancorp is an attractive buy at the current price? When making that decision, it’s important to consider its valuation, business qualities, as well as what has happened in the latest quarter. We cover that in our actionable full research report which you can read here, it’s free for active Edge members.