
Regional banking company WesBanco (NASDAQ: WSBC) met Wall Street’s revenue expectations in Q3 CY2025, with sales up 73.5% year on year to $261.6 million. Its GAAP profit of $0.84 per share was 3.6% below analysts’ consensus estimates.
Is now the time to buy WesBanco? Find out by accessing our full research report, it’s free for active Edge members.
WesBanco (WSBC) Q3 CY2025 Highlights:
- Net Interest Income: $216.7 million vs analyst estimates of $219.1 million (78.9% year-on-year growth, 1.1% miss)
- Net Interest Margin: 3.5% vs analyst estimates of 3.5% (in line)
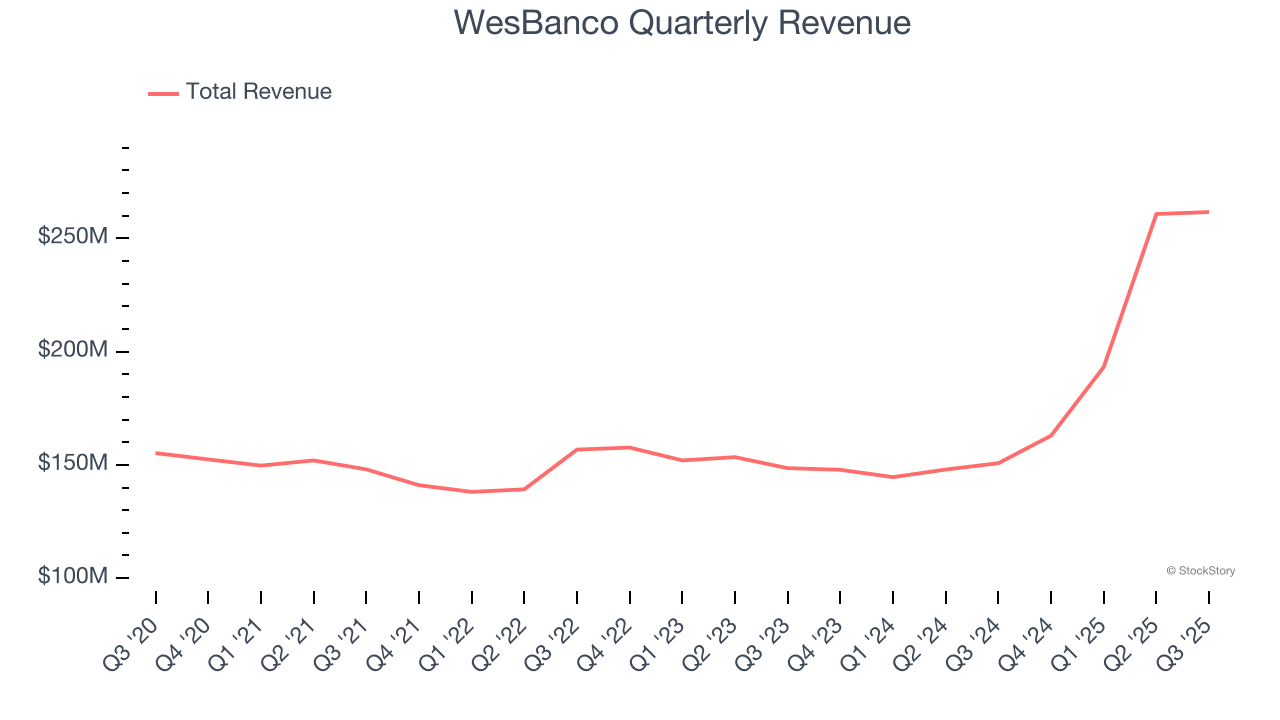
- Revenue: $261.6 million vs analyst estimates of $262 million (73.5% year-on-year growth, in line)
- Efficiency Ratio: 55.1% vs analyst estimates of 54.8% (35 basis point miss)
- EPS (GAAP): $0.84 vs analyst expectations of $0.87 (3.6% miss)
- Tangible Book Value per Share: $21.29 vs analyst estimates of $20.95 (7% year-on-year decline, 1.6% beat)
- Market Capitalization: $3.01 billion
"Our third quarter results demonstrate the successful integration of Premier and continued operational discipline. Despite elevated commercial real estate payoffs, we delivered strong loan growth, fully funded by deposit growth, while meaningfully expanding our net interest margin and fee income. Combined with our focus on cost control, these efforts drove positive operating leverage and an improved efficiency ratio in the mid-50s," said Jeff Jackson, President and CEO.
Company Overview
Tracing its roots back to 1870 in West Virginia, WesBanco (NASDAQ: WSBC) is a bank holding company that provides retail and commercial banking, trust services, insurance, and investment products through its subsidiaries across several Midwestern and Mid-Atlantic states.
Sales Growth
Net interest income and and fee-based revenue are the two pillars supporting bank earnings. The former captures profit from the gap between lending rates and deposit costs, while the latter encompasses charges for banking services, credit products, wealth management, and trading activities. Thankfully, WesBanco’s 8.2% annualized revenue growth over the last five years was solid. Its growth beat the average banking company and shows its offerings resonate with customers.
Long-term growth is the most important, but within financials, a half-decade historical view may miss recent interest rate changes and market returns. WesBanco’s annualized revenue growth of 19.8% over the last two years is above its five-year trend, suggesting its demand was strong and recently accelerated. 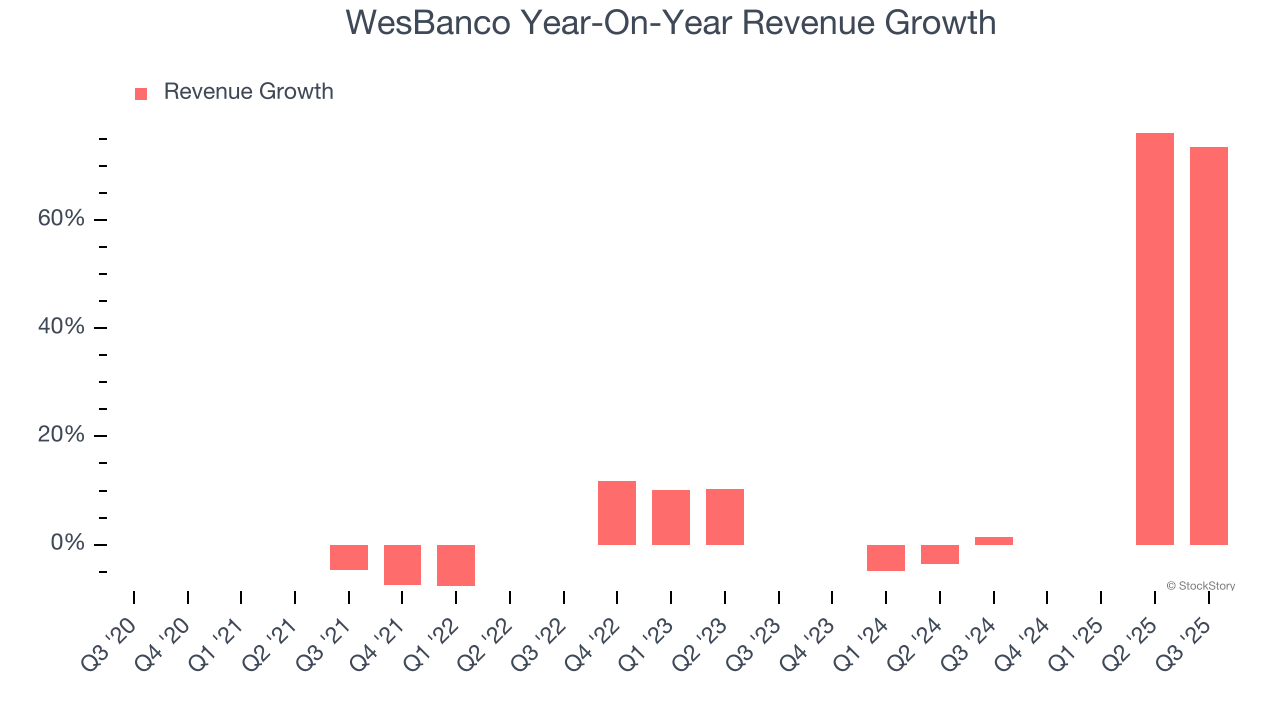 Note: Quarters not shown were determined to be outliers, impacted by outsized investment gains/losses that are not indicative of the recurring fundamentals of the business.
This quarter, WesBanco’s year-on-year revenue growth of 73.5% was magnificent, and its $261.6 million of revenue was in line with Wall Street’s estimates.
Net interest income made up 79.6% of the company’s total revenue during the last five years, meaning lending operations are WesBanco’s largest source of revenue.
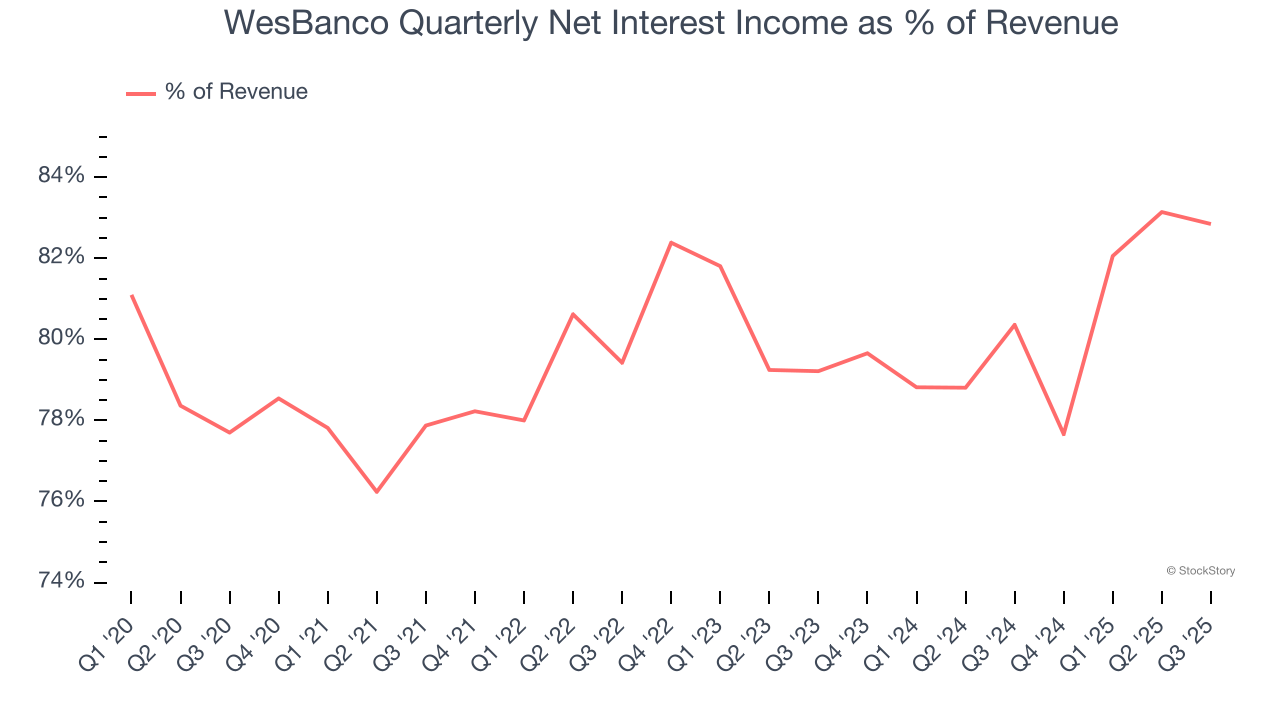
Markets consistently prioritize net interest income growth over fee-based revenue, recognizing its superior quality and recurring nature compared to the more unpredictable non-interest income streams.
Here at StockStory, we certainly understand the potential of thematic investing. Diverse winners from Microsoft (MSFT) to Alphabet (GOOG), Coca-Cola (KO) to Monster Beverage (MNST) could all have been identified as promising growth stories with a megatrend driving the growth. So, in that spirit, we’ve identified a relatively under-the-radar profitable growth stock benefiting from the rise of AI, available to you FREE via this link.
Tangible Book Value Per Share (TBVPS)
The balance sheet drives banking profitability since earnings flow from the spread between borrowing and lending rates. As such, valuations for these companies concentrate on capital strength and sustainable equity accumulation potential.
Because of this, tangible book value per share (TBVPS) emerges as the critical performance benchmark. By excluding intangible assets with uncertain liquidation values, this metric captures real, liquid net worth per share. Other (and more commonly known) per-share metrics like EPS can sometimes be murky due to M&A or accounting rules allowing for loan losses to be spread out.
WesBanco’s TBVPS was flat over the last five years. However, TBVPS growth has accelerated recently, growing by 4% annually over the last two years from $19.69 to $21.29 per share.
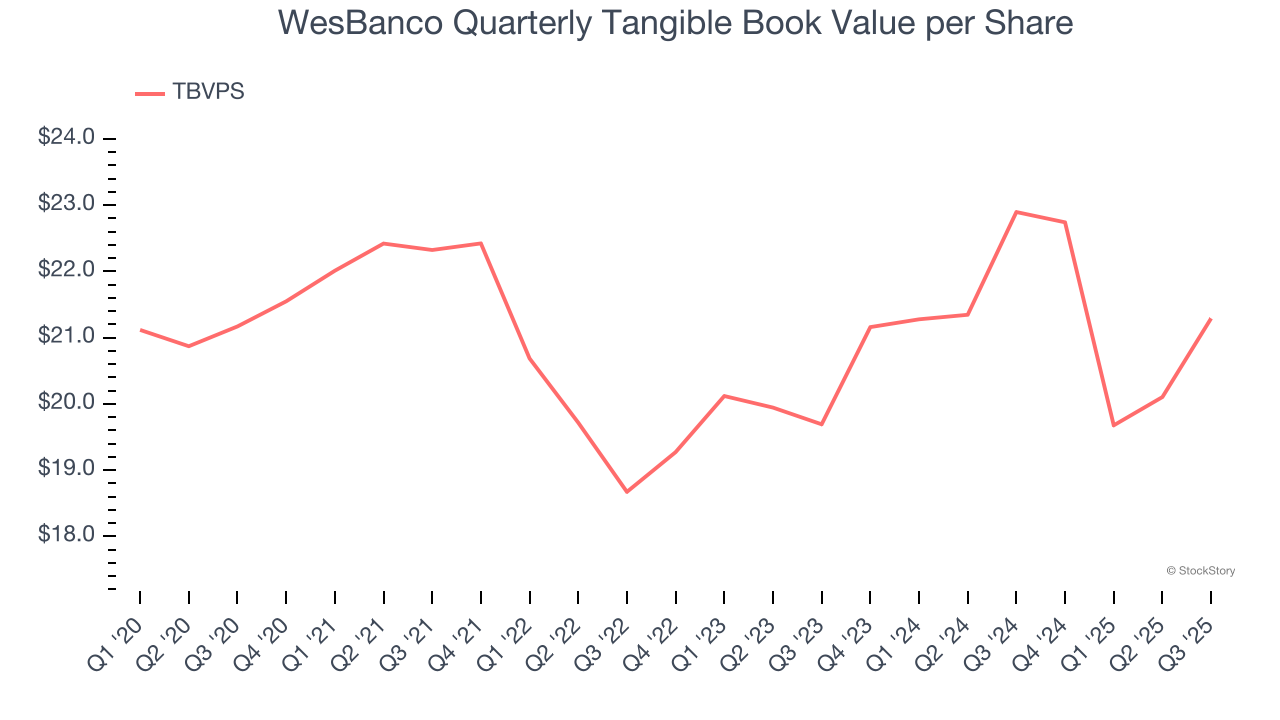
Over the next 12 months, Consensus estimates call for WesBanco’s TBVPS to grow by 10.5% to $23.52, solid growth rate.
Key Takeaways from WesBanco’s Q3 Results
It was encouraging to see WesBanco beat analysts’ tangible book value per share expectations this quarter. On the other hand, its EPS missed and its net interest income fell slightly short of Wall Street’s estimates. Overall, this was a softer quarter. The stock still traded up 1.4% to $31.80 immediately following the results.
Is WesBanco an attractive investment opportunity right now? When making that decision, it’s important to consider its valuation, business qualities, as well as what has happened in the latest quarter. We cover that in our actionable full research report which you can read here, it’s free for active Edge members.


