
Over the last six months, Strategy’s shares have sunk to $280.75, producing a disappointing 18.8% loss - a stark contrast to the S&P 500’s 24.7% gain. This might have investors contemplating their next move.
Is now the time to buy Strategy, or should you be careful about including it in your portfolio? Check out our in-depth research report to see what our analysts have to say, it’s free for active Edge members.
Why Do We Think Strategy Will Underperform?
Even though the stock has become cheaper, we're swiping left on Strategy for now. Here are three reasons there are better opportunities than MSTR and a stock we'd rather own.
Note that our analysis is rooted in fundamentals, not Bitcoin-driven technicals.
1. Declining Billings Reflect Product and Sales Weakness
Billings is a non-GAAP metric that is often called “cash revenue” because it shows how much money the company has collected from customers in a certain period. This is different from revenue, which must be recognized in pieces over the length of a contract.
Strategy’s billings came in at $113.3 million in Q2, and it averaged 3.1% year-on-year declines over the last four quarters. This performance was underwhelming and shows the company faced challenges in acquiring and retaining customers. It also suggests there may be increasing competition or market saturation. 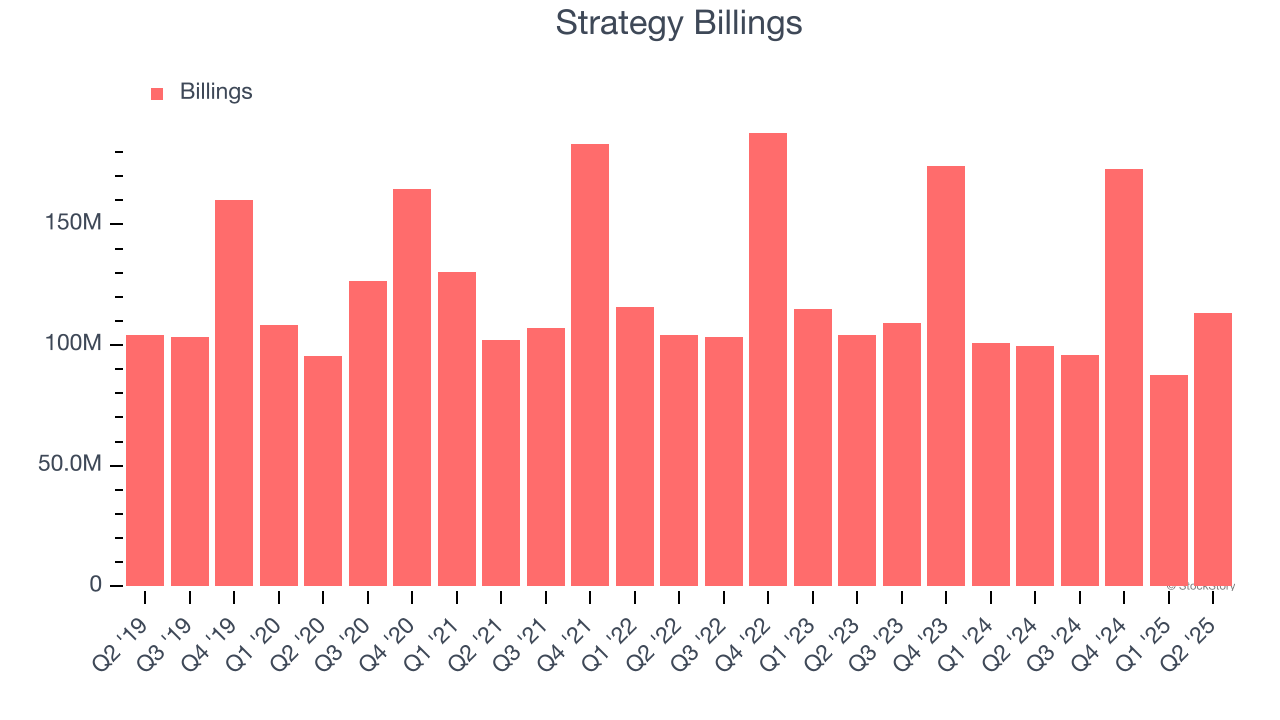
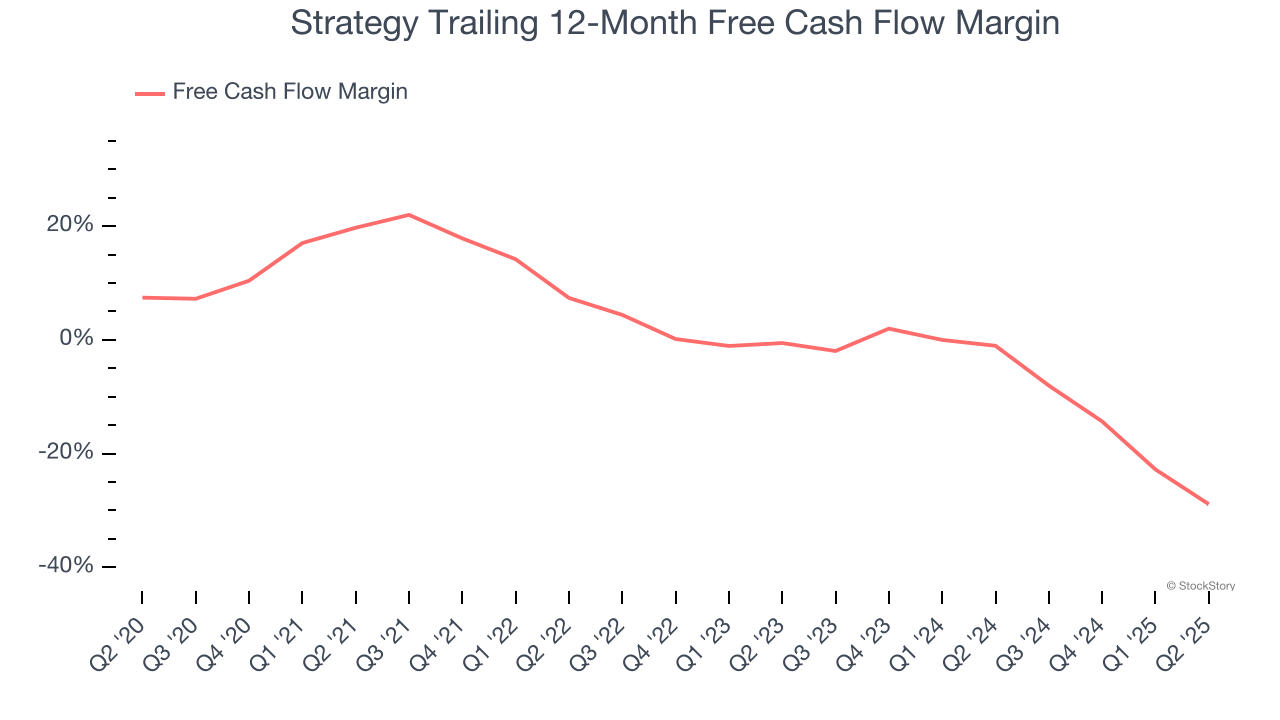
2. Cash Burn Ignites Concerns
Free cash flow isn't a prominently featured metric in company financials and earnings releases, but we think it's telling because it accounts for all operating and capital expenses, making it tough to manipulate. Cash is king.
Strategy’s demanding reinvestments have drained its resources over the last year, putting it in a pinch and limiting its ability to return capital to investors. Its free cash flow margin averaged negative 28.9%, meaning it lit $28.90 of cash on fire for every $100 in revenue. This is a stark contrast from its operating margin, and its investments (i.e., stocking inventory, building new facilities) are the primary culprit.
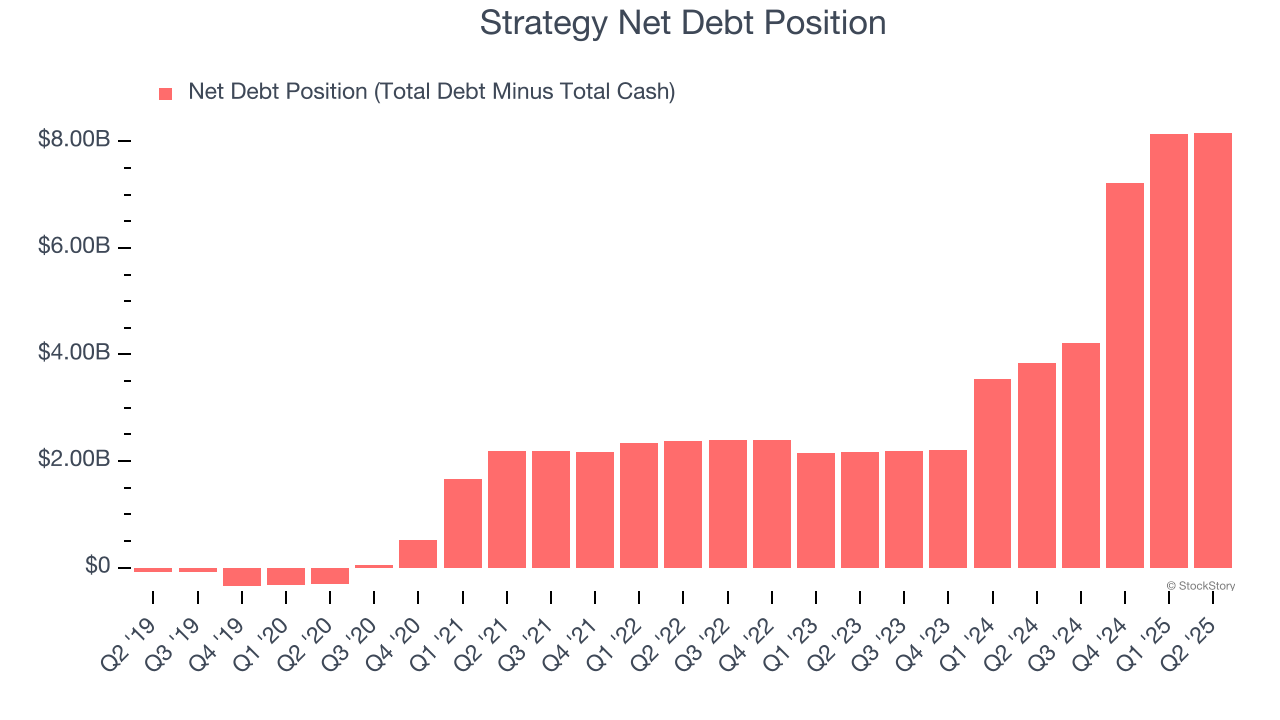
3. Short Cash Runway Exposes Shareholders to Potential Dilution
As long-term investors, the risk we care about most is the permanent loss of capital, which can happen when a company goes bankrupt or raises money from a disadvantaged position. This is separate from short-term stock price volatility, something we are much less bothered by.
Strategy burned through $133.6 million of cash over the last year, and its $8.21 billion of debt exceeds the $50.1 million of cash on its balance sheet. This is a deal breaker for us because indebted loss-making companies spell trouble.
Unless the Strategy’s fundamentals change quickly, it might find itself in a position where it must raise capital from investors to continue operating. Whether that would be favorable is unclear because dilution is a headwind for shareholder returns.
We remain cautious of Strategy until it generates consistent free cash flow or any of its announced financing plans materialize on its balance sheet.
Final Judgment
Strategy falls short of our quality standards. After the recent drawdown, the stock trades at 181.6× forward price-to-sales (or $280.75 per share). This valuation tells us it’s a bit of a market darling with a lot of good news priced in - we think there are better opportunities elsewhere. We’d recommend looking at a top digital advertising platform riding the creator economy.
High-Quality Stocks for All Market Conditions
Donald Trump’s April 2025 "Liberation Day" tariffs sent markets into a tailspin, but stocks have since rebounded strongly, proving that knee-jerk reactions often create the best buying opportunities.
The smart money is already positioning for the next leg up. Don’t miss out on the recovery - check out our Top 6 Stocks for this week. This is a curated list of our High Quality stocks that have generated a market-beating return of 183% over the last five years (as of March 31st 2025).
Stocks that made our list in 2020 include now familiar names such as Nvidia (+1,545% between March 2020 and March 2025) as well as under-the-radar businesses like the once-small-cap company Comfort Systems (+782% five-year return). Find your next big winner with StockStory today.
StockStory is growing and hiring equity analyst and marketing roles. Are you a 0 to 1 builder passionate about the markets and AI? See the open roles here.


