
Financial technology company Enova International (NYSE: ENVA) met Wall Street’s revenue expectations in Q3 CY2025, with sales up 16.3% year on year to $802.7 million. Its non-GAAP profit of $3.36 per share was 10.8% above analysts’ consensus estimates.
Is now the time to buy Enova? Find out by accessing our full research report, it’s free for active Edge members.
Enova (ENVA) Q3 CY2025 Highlights:
- Revenue: $802.7 million vs analyst estimates of $806.7 million (16.3% year-on-year growth, in line)
- Pre-tax Profit: $110.2 million (13.7% margin, 98.5% year-on-year growth)
- Adjusted EPS: $3.36 vs analyst estimates of $3.03 (10.8% beat)
- Market Capitalization: $2.85 billion
"We are pleased to report another solid quarter driven by strong demand and stable credit performance across both our SMB and consumer businesses," said David Fisher, Enova's CEO.
Company Overview
Pioneering online lending since 2004 with a massive database of over 65 terabytes of customer behavior data, Enova International (NYSE: ENVA) provides online financial services including installment loans and lines of credit to non-prime consumers and small businesses in the United States and Brazil.
Revenue Growth
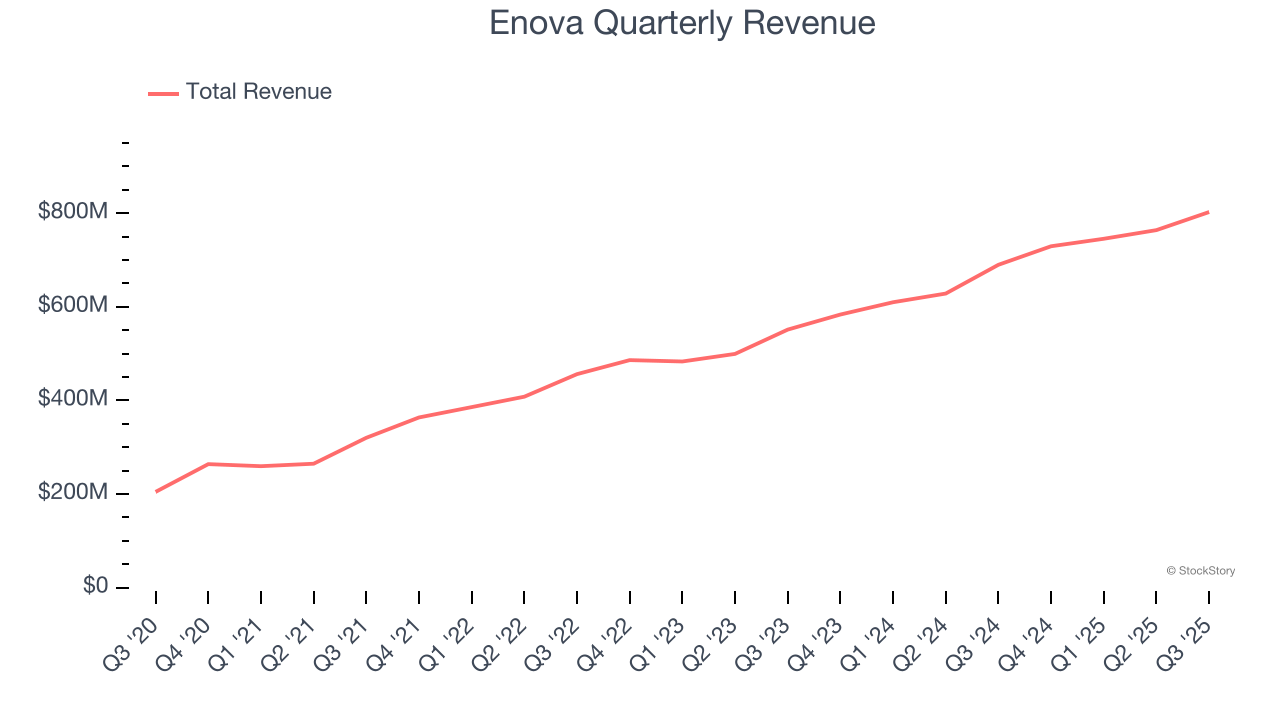
Examining a company’s long-term performance can provide clues about its quality. Any business can experience short-term success, but top-performing ones enjoy sustained growth for years. Over the last five years, Enova grew its revenue at an excellent 21.2% compounded annual growth rate. Its growth surpassed the average financials company and shows its offerings resonate with customers, a great starting point for our analysis.
Long-term growth is the most important, but within financials, a half-decade historical view may miss recent interest rate changes and market returns. Enova’s annualized revenue growth of 22.7% over the last two years is above its five-year trend, suggesting its demand was strong and recently accelerated. 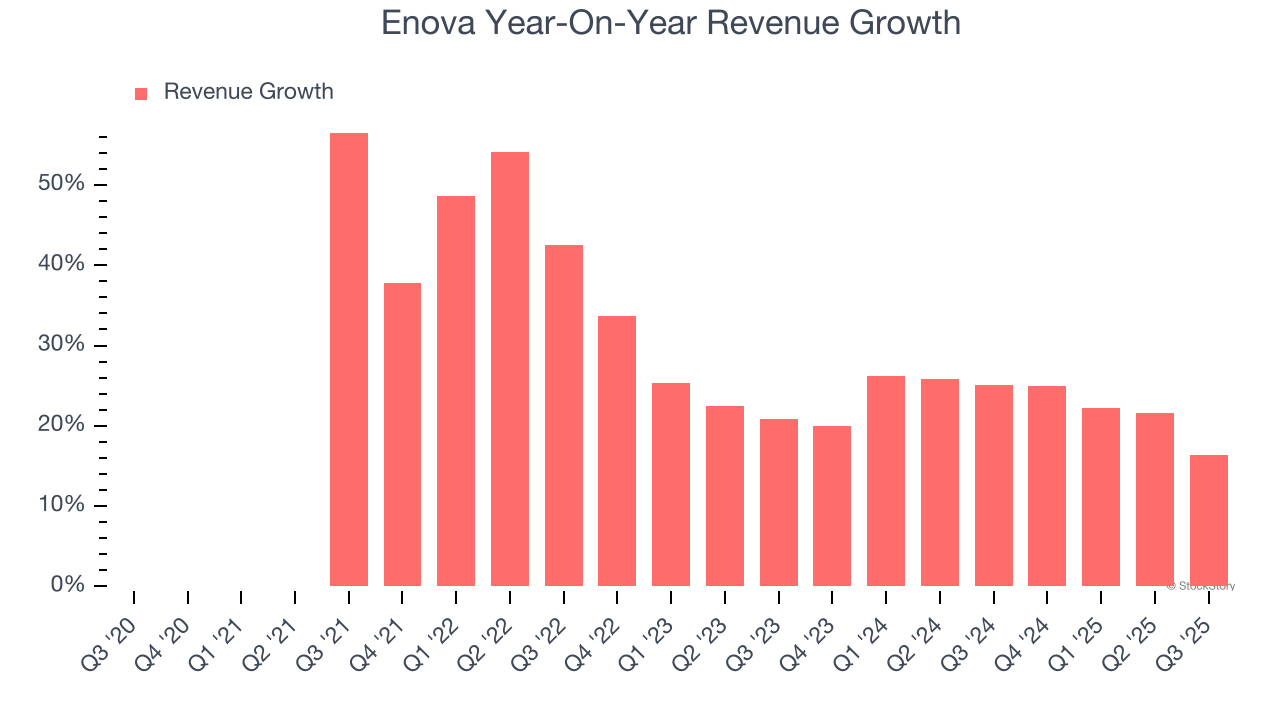 Note: Quarters not shown were determined to be outliers, impacted by outsized investment gains/losses that are not indicative of the recurring fundamentals of the business.
This quarter, Enova’s year-on-year revenue growth was 16.3%, and its $802.7 million of revenue was in line with Wall Street’s estimates.
Today’s young investors won’t have read the timeless lessons in Gorilla Game: Picking Winners In High Technology because it was written more than 20 years ago when Microsoft and Apple were first establishing their supremacy. But if we apply the same principles, then enterprise software stocks leveraging their own generative AI capabilities may well be the Gorillas of the future. So, in that spirit, we are excited to present our Special Free Report on a profitable, fast-growing enterprise software stock that is already riding the automation wave and looking to catch the generative AI next.
Key Takeaways from Enova’s Q3 Results
It was good to see Enova beat analysts’ EPS expectations this quarter despite in line revenue. Pre-tax profit also grew nicely year on year. Overall, this print had some key positives. The stock remained flat at $113.60 immediately after reporting.
So do we think Enova is an attractive buy at the current price? We think that the latest quarter is only one piece of the longer-term business quality puzzle. Quality, when combined with valuation, can help determine if the stock is a buy. We cover that in our actionable full research report which you can read here, it’s free for active Edge members.