
Financial holding company Hilltop Holdings (NYSE: HTH) beat Wall Street’s revenue expectations in Q3 CY2025, with sales up 7.5% year on year to $330.2 million. Its GAAP profit of $0.74 per share was 46.5% above analysts’ consensus estimates.
Is now the time to buy Hilltop Holdings? Find out by accessing our full research report, it’s free for active Edge members.
Hilltop Holdings (HTH) Q3 CY2025 Highlights:
- Net Interest Income: $112.4 million vs analyst estimates of $110.3 million (7% year-on-year growth, 1.9% beat)
- Net Interest Margin: 3.1% vs analyst estimates of 3% (9.5 basis point beat)
- Revenue: $330.2 million vs analyst estimates of $310.6 million (7.5% year-on-year growth, 6.3% beat)
- Efficiency Ratio: 51.7% vs analyst estimates of 84.1% (3,237.5 basis point beat)
- EPS (GAAP): $0.74 vs analyst estimates of $0.51 (46.5% beat)
- Tangible Book Value per Share: $35.69 vs analyst estimates of $31.14 (21.9% year-on-year growth, 14.6% beat)
- Market Capitalization: $2.05 billion
Jeremy B. Ford, Chairman, President and CEO of Hilltop, said, “Hilltop delivered a 1.2% return on average assets during the third quarter on net income of $46 million. Within PlainsCapital Bank, strong core loan and deposit growth on a linked-quarter basis, along with healthy net interest margin expansion, generated $55 million in pre-tax income during the third quarter. A dampened summer home-buying market weighed down PrimeLending’s operating results as the company produced a pre-tax loss of $7 million on flat year-over-year origination volumes and depressed origination fees. We continue to actively manage down fixed expenses within our mortgage origination business. Additionally, robust results within all business lines at HilltopSecurities resulted in a pre-tax margin of 18% on net revenues of $144 million.
Company Overview
Transformed from a residential communities business to a financial services powerhouse in 2007, Hilltop Holdings (NYSE: HTH) is a Texas-based financial holding company that provides banking, broker-dealer, and mortgage origination services.
Sales Growth
In general, banks make money from two primary sources. The first is net interest income, which is interest earned on loans, mortgages, and investments in securities minus interest paid out on deposits. The second source is non-interest income, which can come from bank account, credit card, wealth management, investing banking, and trading fees. Hilltop Holdings’s demand was weak over the last five years as its revenue fell at a 8.2% annual rate. This wasn’t a great result and suggests it’s a low quality business.
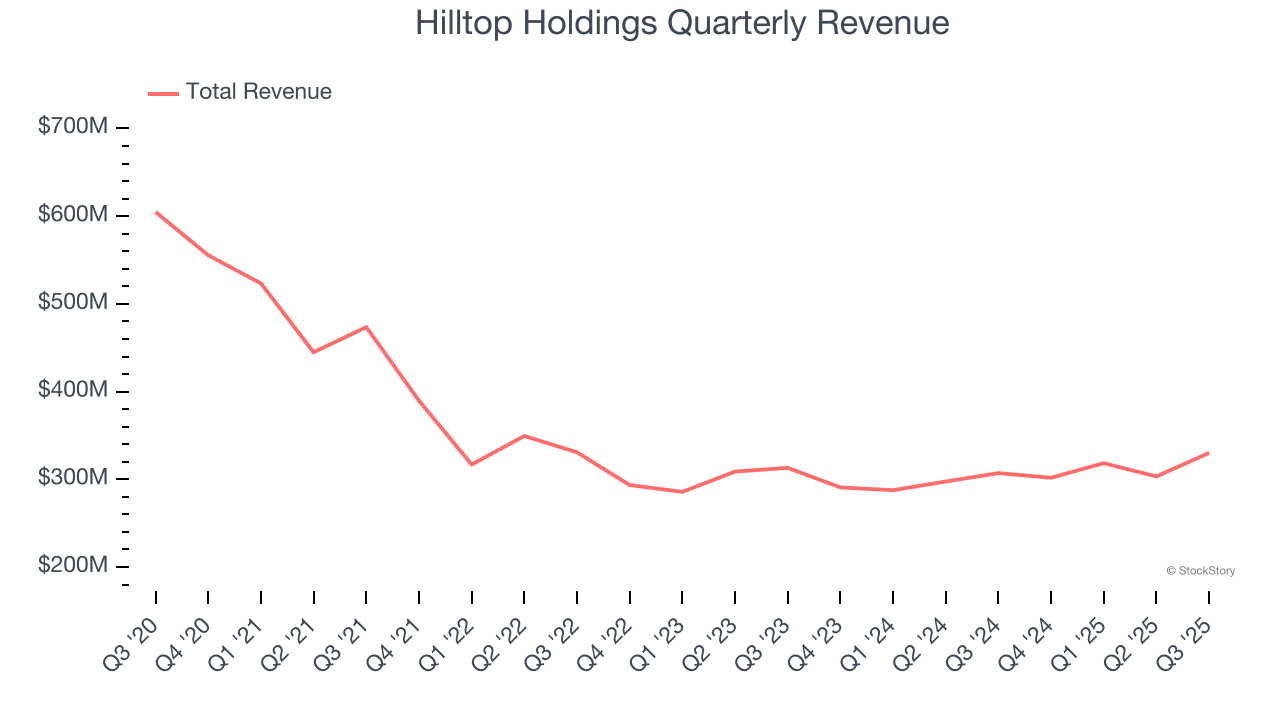
We at StockStory place the most emphasis on long-term growth, but within financials, a half-decade historical view may miss recent interest rate changes, market returns, and industry trends. Hilltop Holdings’s annualized revenue growth of 2.2% over the last two years is above its five-year trend, but we were still disappointed by the results. 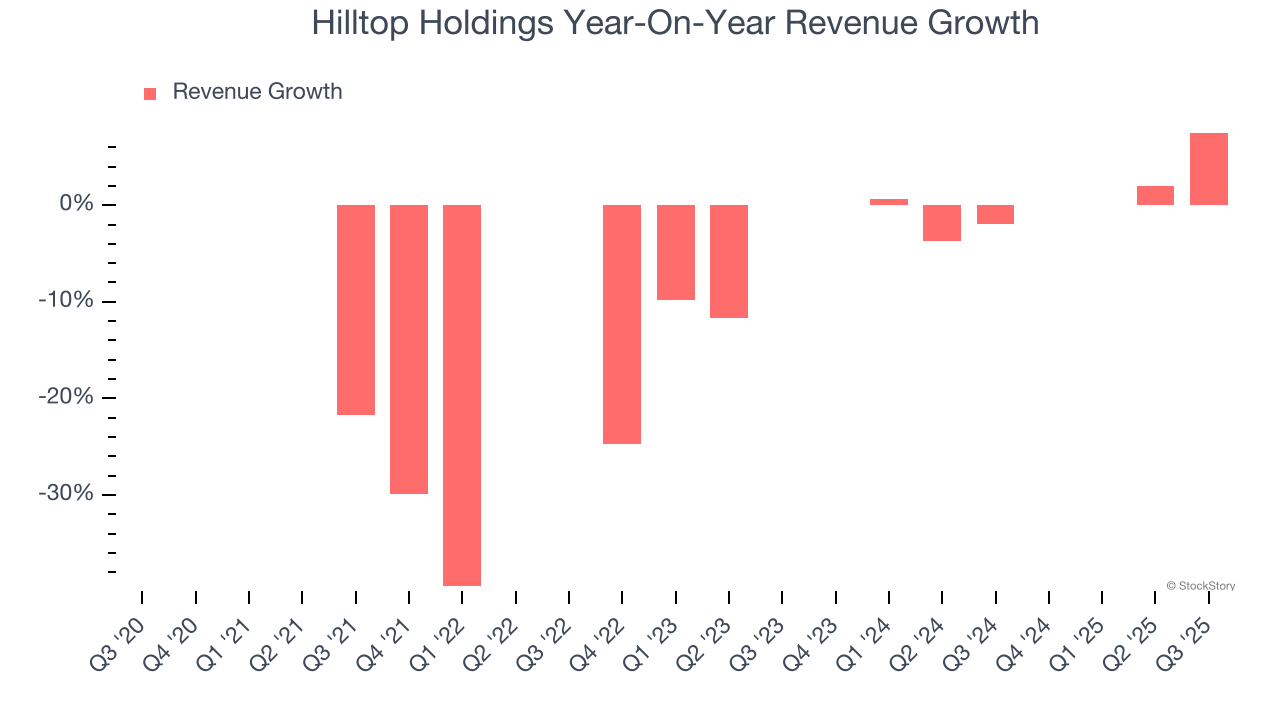 Note: Quarters not shown were determined to be outliers, impacted by outsized investment gains/losses that are not indicative of the recurring fundamentals of the business.
This quarter, Hilltop Holdings reported year-on-year revenue growth of 7.5%, and its $330.2 million of revenue exceeded Wall Street’s estimates by 6.3%.
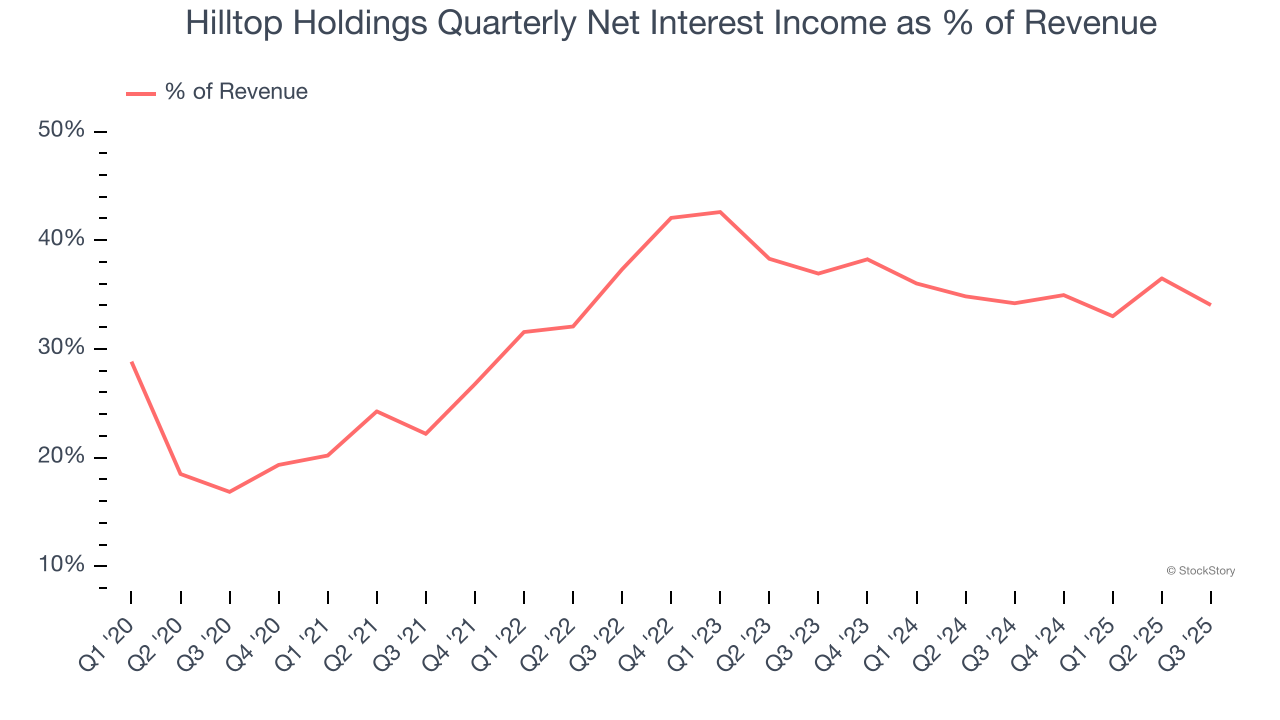
Net interest income made up 32.8% of the company’s total revenue during the last five years, meaning Hilltop Holdings is well diversified and has a variety of income streams driving its overall growth. Nevertheless, net interest income is critical to analyze for banks because they’re considered a higher-quality, more recurring revenue source by investors.
Unless you’ve been living under a rock, it should be obvious by now that generative AI is going to have a huge impact on how large corporations do business. While Nvidia and AMD are trading close to all-time highs, we prefer a lesser-known (but still profitable) stock benefiting from the rise of AI. Click here to access our free report one of our favorites growth stories.
Tangible Book Value Per Share (TBVPS)
Banks are balance sheet-driven businesses because they generate earnings primarily through borrowing and lending. They’re also valued based on their balance sheet strength and ability to compound book value (another name for shareholders’ equity) over time.
This explains why tangible book value per share (TBVPS) stands as the premier banking metric. TBVPS strips away questionable intangible assets, revealing concrete per-share net worth that investors can trust. Other (and more commonly known) per-share metrics like EPS can sometimes be murky due to M&A or accounting rules allowing for loan losses to be spread out.
Hilltop Holdings’s TBVPS grew at an excellent 8.7% annual clip over the last five years. TBVPS growth has also accelerated recently, growing by 13.6% annually over the last two years from $27.67 to $35.69 per share.
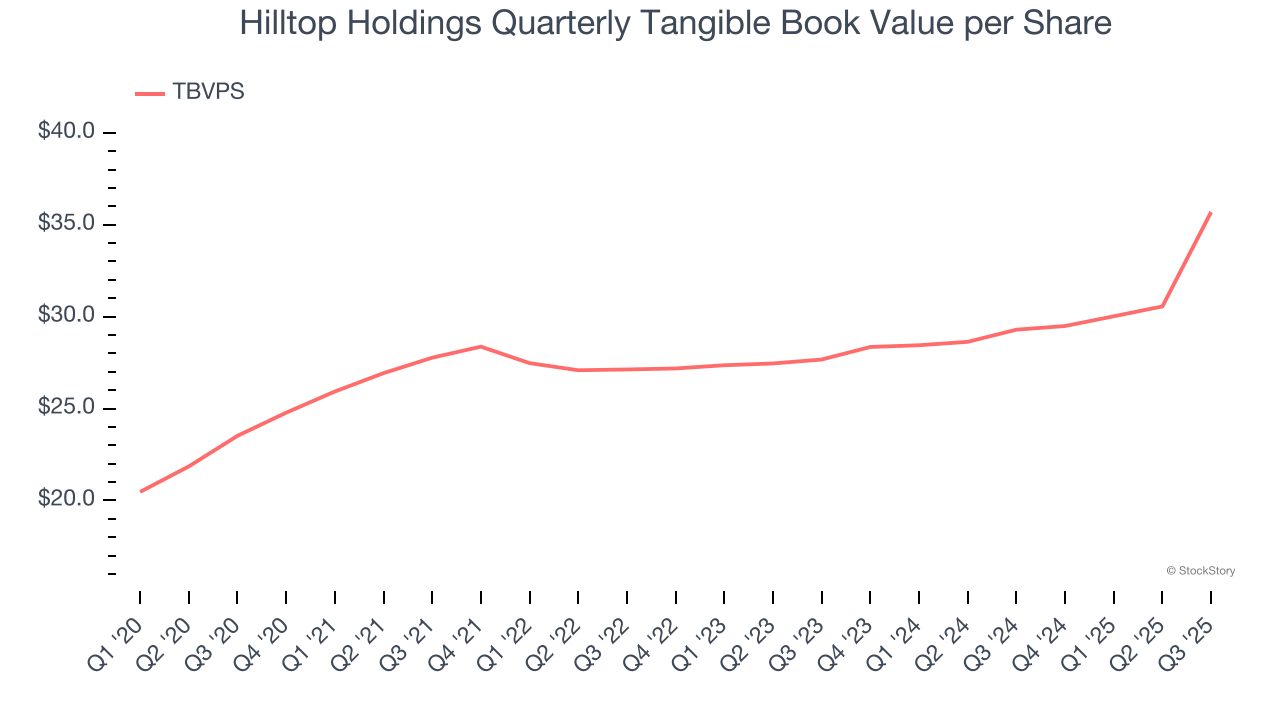
Over the next 12 months, Consensus estimates call for Hilltop Holdings’s TBVPS to shrink by 10% to $32.13, a sour projection.
Key Takeaways from Hilltop Holdings’s Q3 Results
It was good to see Hilltop Holdings beat analysts’ EPS expectations this quarter. We were also excited its revenue outperformed Wall Street’s estimates by a wide margin. Zooming out, we think this was a good print with some key areas of upside. The stock traded up 1.2% to $32.82 immediately after reporting.
Sure, Hilltop Holdings had a solid quarter, but if we look at the bigger picture, is this stock a buy? What happened in the latest quarter matters, but not as much as longer-term business quality and valuation, when deciding whether to invest in this stock. We cover that in our actionable full research report which you can read here, it’s free for active Edge members.