Computer processor maker Intel (NASDAQ: INTC) beat Wall Street’s revenue expectations in Q3 CY2025, with sales up 2.8% year on year to $13.65 billion. On the other hand, next quarter’s revenue guidance of $13.3 billion was less impressive, coming in 0.8% below analysts’ estimates. Its non-GAAP profit of $0.08 per share was significantly above analysts’ consensus estimates.
Is now the time to buy Intel? Find out by accessing our full research report, it’s free for active Edge members.
Intel (INTC) Q3 CY2025 Highlights:
- Revenue: $13.65 billion vs analyst estimates of $13.17 billion (2.8% year-on-year growth, 3.7% beat)
- Adjusted EPS: $0.08 vs analyst estimates of $0.01 (significant beat)
- Adjusted Operating Income: $1.52 billion vs analyst estimates of $410.4 million (11.2% margin, significant beat)
- Revenue Guidance for Q4 CY2025 is $13.3 billion at the midpoint, below analyst estimates of $13.4 billion
- Adjusted EPS guidance for Q4 CY2025 is $0.08 at the midpoint, below analyst estimates of $0.08
- Operating Margin: 5%, up from -68.2% in the same quarter last year
- Free Cash Flow was $896 million, up from -$2.7 billion in the same quarter last year
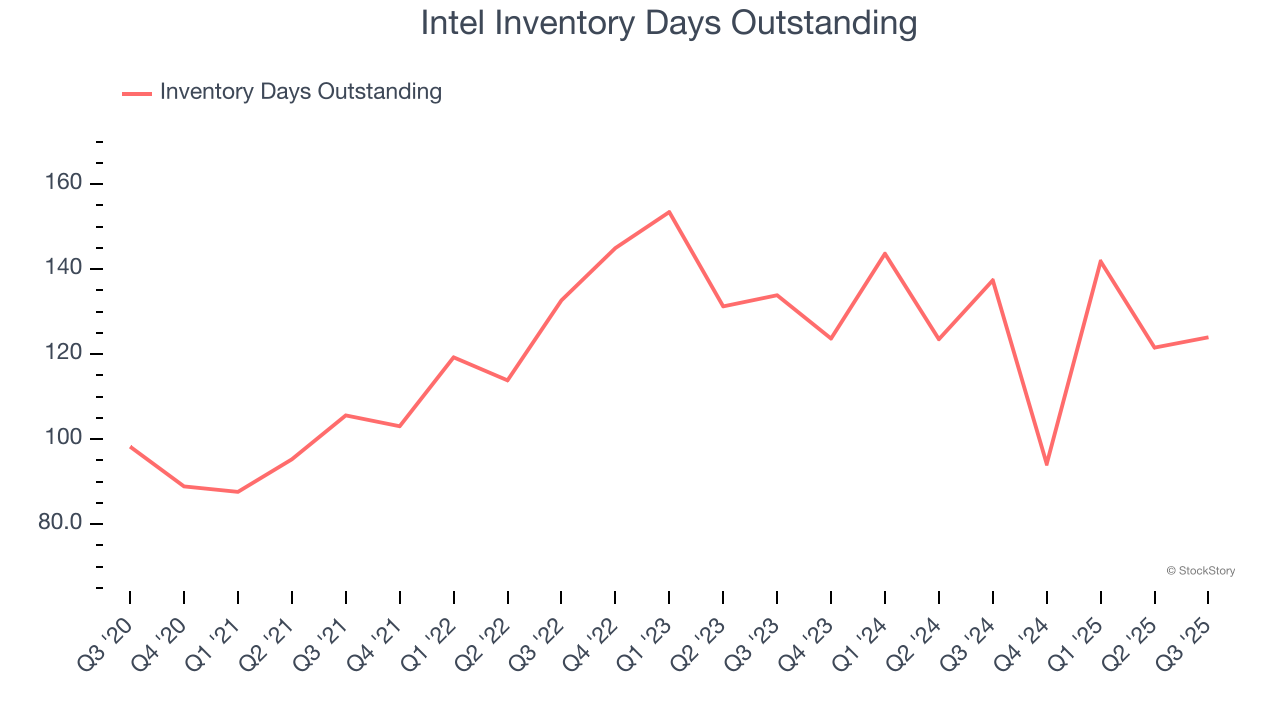
- Inventory Days Outstanding: 124, up from 122 in the previous quarter
- Market Capitalization: $175.6 billion
“Our Q3 results reflect improved execution and steady progress against our strategic priorities,” said Lip-Bu Tan, Intel CEO.
Company Overview
Inventor of the x86 processor that powered decades of technological innovation in PCs, data centers, and numerous other markets, Intel (NASDAQ: INTC) is a leading manufacturer of computer processors and graphics chips.
Revenue Growth
Reviewing a company’s long-term sales performance reveals insights into its quality. Any business can put up a good quarter or two, but many enduring ones grow for years. Over the last five years, Intel’s demand was weak and its revenue declined by 7.3% per year. This was below our standards and suggests it’s a low quality business. Semiconductors are a cyclical industry, and long-term investors should be prepared for periods of high growth followed by periods of revenue contractions.
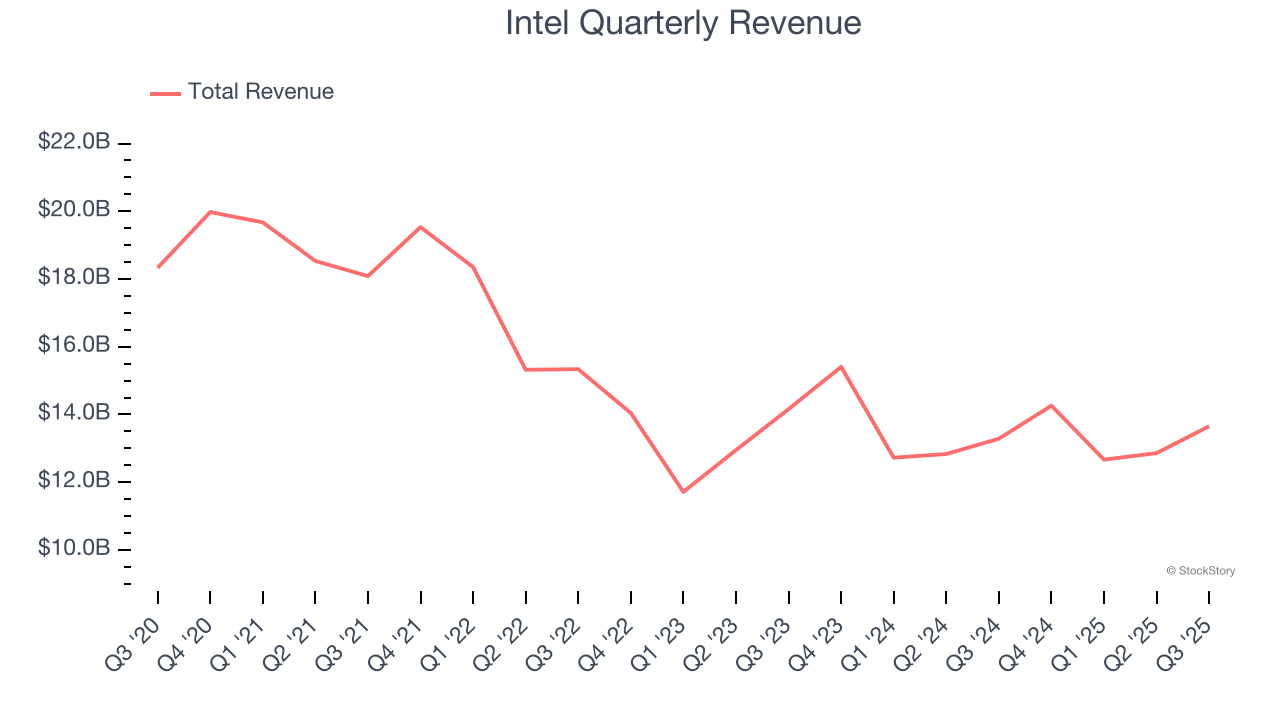
We at StockStory place the most emphasis on long-term growth, but within semiconductors, a half-decade historical view may miss new demand cycles or industry trends like AI. Intel’s revenue over the last two years was flat, sugggesting its demand was weak but stabilized after its initial drop. 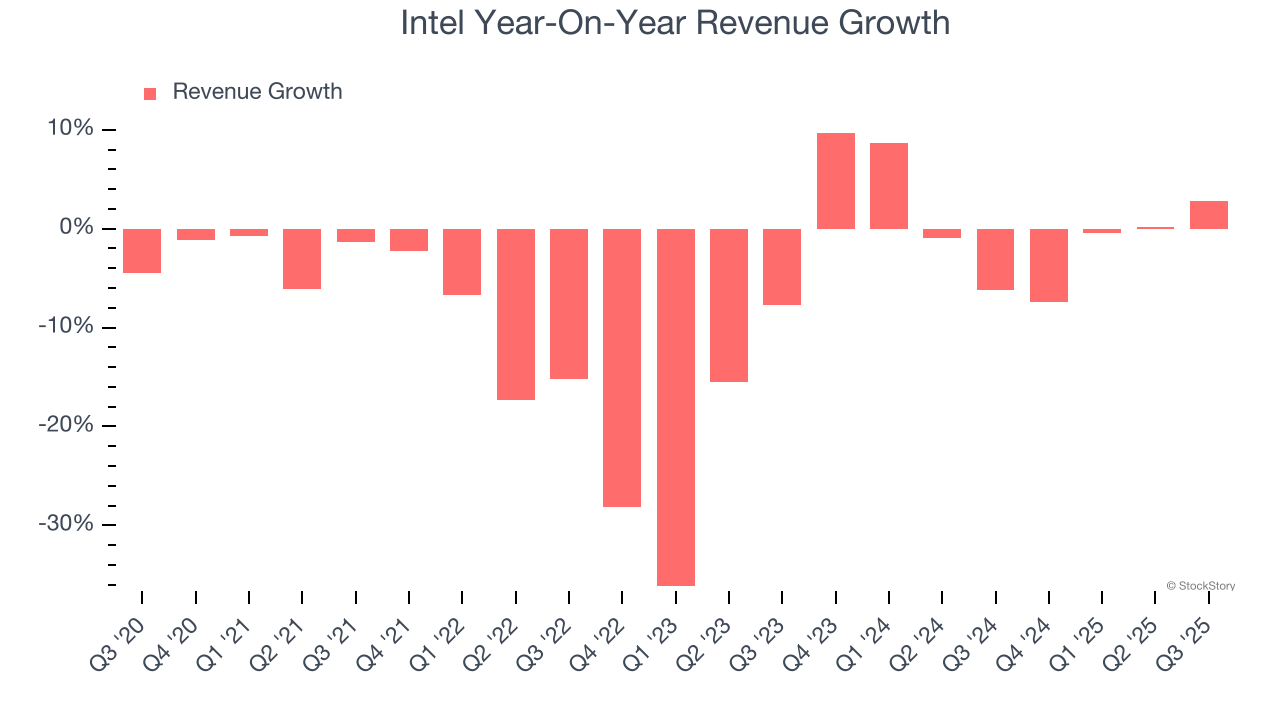
This quarter, Intel reported modest year-on-year revenue growth of 2.8% but beat Wall Street’s estimates by 3.7%. Company management is currently guiding for a 6.7% year-on-year decline in sales next quarter.
Looking further ahead, sell-side analysts expect revenue to decline by 1.2% over the next 12 months, a slight deceleration versus the last two years. This projection doesn't excite us and indicates its products and services will face some demand challenges.
Today’s young investors won’t have read the timeless lessons in Gorilla Game: Picking Winners In High Technology because it was written more than 20 years ago when Microsoft and Apple were first establishing their supremacy. But if we apply the same principles, then enterprise software stocks leveraging their own generative AI capabilities may well be the Gorillas of the future. So, in that spirit, we are excited to present our Special Free Report on a profitable, fast-growing enterprise software stock that is already riding the automation wave and looking to catch the generative AI next.
Product Demand & Outstanding Inventory
Days Inventory Outstanding (DIO) is an important metric for chipmakers, as it reflects a business’ capital intensity and the cyclical nature of semiconductor supply and demand. In a tight supply environment, inventories tend to be stable, allowing chipmakers to exert pricing power. Steadily increasing DIO can be a warning sign that demand is weak, and if inventories continue to rise, the company may have to downsize production.
This quarter, Intel’s DIO came in at 124, which is 3 more days than its five-year average, suggesting that the company’s inventory levels have grown slightly above the long-term average.
Key Takeaways from Intel’s Q3 Results
It was good to see Intel beat analysts’ EPS expectations this quarter. We were also excited its adjusted operating income outperformed Wall Street’s estimates by a wide margin. On the other hand, its revenue guidance for next quarter slightly missed and its inventory levels slightly increased. Overall, we think this was still a solid quarter with some key areas of upside. The stock traded up 8.4% to $41.38 immediately after reporting.
Intel put up rock-solid earnings, but one quarter doesn’t necessarily make the stock a buy. Let’s see if this is a good investment. If you’re making that decision, you should consider the bigger picture of valuation, business qualities, as well as the latest earnings. We cover that in our actionable full research report which you can read here, it’s free for active Edge members.