
Regional banking company S&T Bancorp (NASDAQ: STBA) met Wall Street’s revenue expectations in Q3 CY2025, with sales up 6.9% year on year to $103 million. Its GAAP profit of $0.91 per share was 6% above analysts’ consensus estimates.
Is now the time to buy S&T Bancorp? Find out by accessing our full research report, it’s free for active Edge members.
S&T Bancorp (STBA) Q3 CY2025 Highlights:
- Net Interest Income: $89.24 million vs analyst estimates of $89.18 million (5.6% year-on-year growth, in line)
- Net Interest Margin: 3.9% vs analyst estimates of 3.9% (5.3 basis point beat)
- Revenue: $103 million vs analyst estimates of $102.7 million (6.9% year-on-year growth, in line)
- Efficiency Ratio: 54.4% vs analyst estimates of 55.8% (135.3 basis point beat)
- EPS (GAAP): $0.91 vs analyst estimates of $0.86 (6% beat)
- Tangible Book Value per Share: $28.69 vs analyst estimates of $28.46 (9.9% year-on-year growth, 0.8% beat)
- Market Capitalization: $1.37 billion
"We delivered another solid quarter with strong return metrics thanks to the efforts of our team and their commitment to our people-forward banking purpose," said Chris McComish, chief executive officer.
Company Overview
Tracing its roots back to 1902 in western Pennsylvania's industrial heartland, S&T Bancorp (NASDAQ: STBA) is a Pennsylvania-based bank holding company that provides retail and commercial banking services, cash management, trust services, and investment advisory solutions.
Sales Growth
From lending activities to service fees, most banks build their revenue model around two income sources. Interest rate spreads between loans and deposits create the first stream, with the second coming from charges on everything from basic bank accounts to complex investment banking transactions. Over the last five years, S&T Bancorp grew its revenue at a mediocre 3.3% compounded annual growth rate. This was below our standard for the banking sector and is a poor baseline for our analysis.
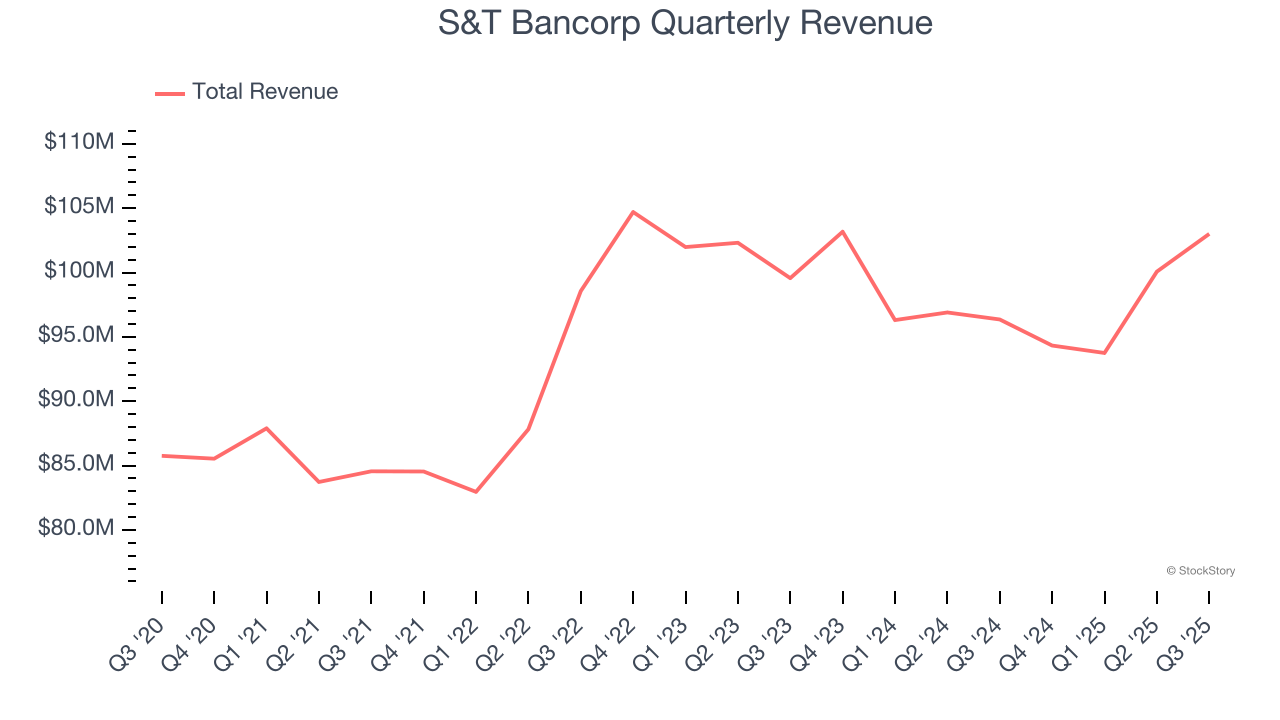
We at StockStory place the most emphasis on long-term growth, but within financials, a half-decade historical view may miss recent interest rate changes, market returns, and industry trends. S&T Bancorp’s performance shows it grew in the past but relinquished its gains over the last two years, as its revenue fell by 2.2% annually. 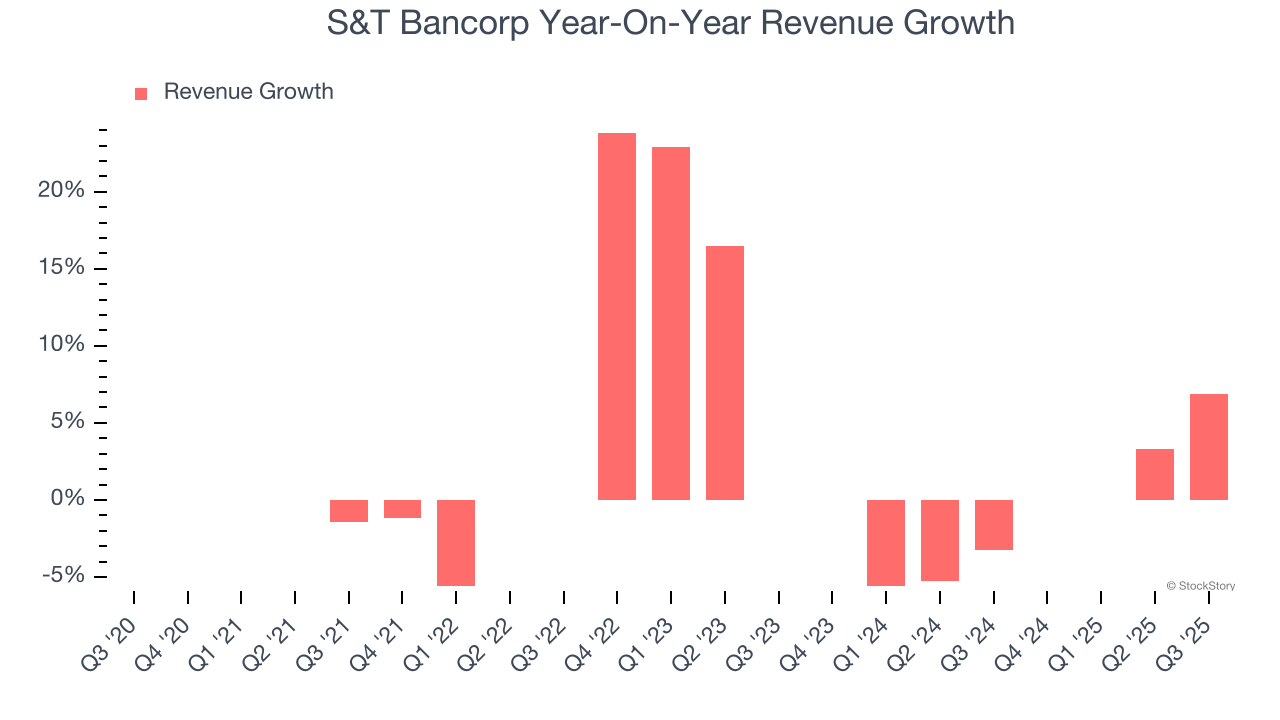 Note: Quarters not shown were determined to be outliers, impacted by outsized investment gains/losses that are not indicative of the recurring fundamentals of the business.
This quarter, S&T Bancorp grew its revenue by 6.9% year on year, and its $103 million of revenue was in line with Wall Street’s estimates.
Net interest income made up 84.9% of the company’s total revenue during the last five years, meaning S&T Bancorp barely relies on non-interest income to drive its overall growth.
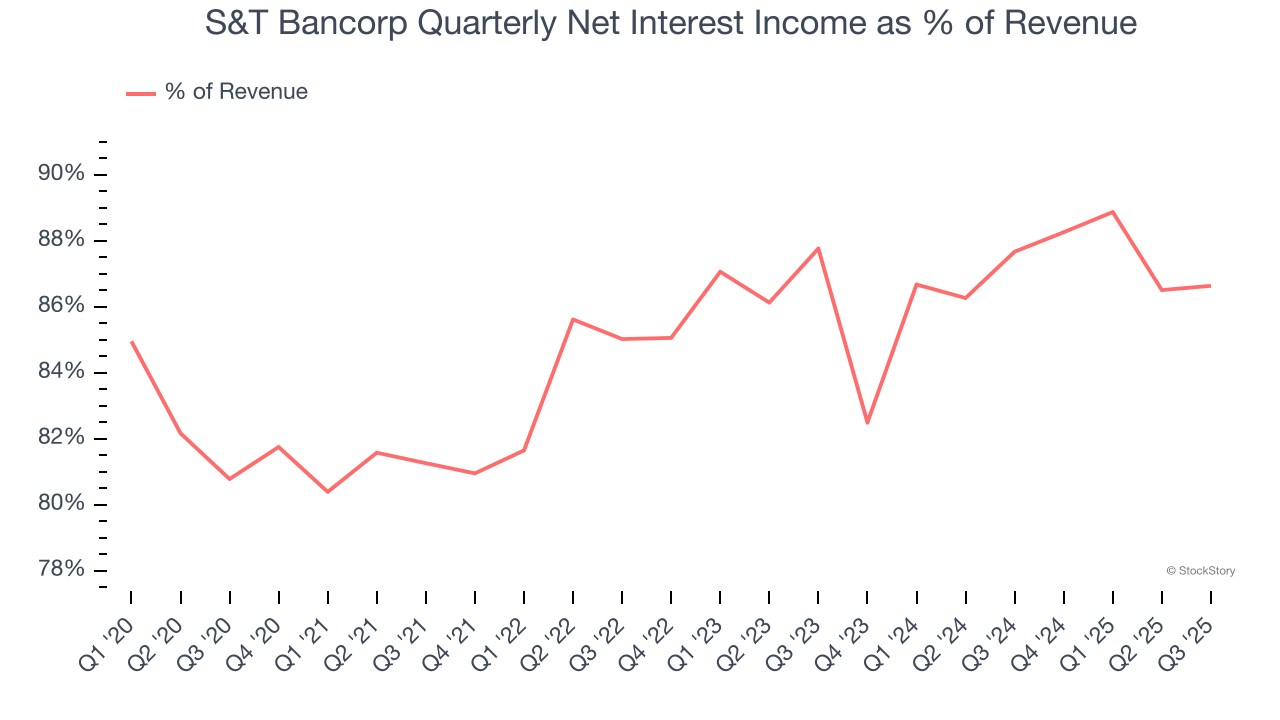
Our experience and research show the market cares primarily about a bank’s net interest income growth as non-interest income is considered a lower-quality and non-recurring revenue source.
Here at StockStory, we certainly understand the potential of thematic investing. Diverse winners from Microsoft (MSFT) to Alphabet (GOOG), Coca-Cola (KO) to Monster Beverage (MNST) could all have been identified as promising growth stories with a megatrend driving the growth. So, in that spirit, we’ve identified a relatively under-the-radar profitable growth stock benefiting from the rise of AI, available to you FREE via this link.
Tangible Book Value Per Share (TBVPS)
Banks are balance sheet-driven businesses because they generate earnings primarily through borrowing and lending. They’re also valued based on their balance sheet strength and ability to compound book value (another name for shareholders’ equity) over time.
This explains why tangible book value per share (TBVPS) stands as the premier banking metric. TBVPS strips away questionable intangible assets, revealing concrete per-share net worth that investors can trust. On the other hand, EPS is often distorted by mergers and flexible loan loss accounting. TBVPS provides clearer performance insights.
S&T Bancorp’s TBVPS grew at an excellent 8.2% annual clip over the last five years. TBVPS growth has also accelerated recently, growing by 13.9% annually over the last two years from $22.11 to $28.69 per share.
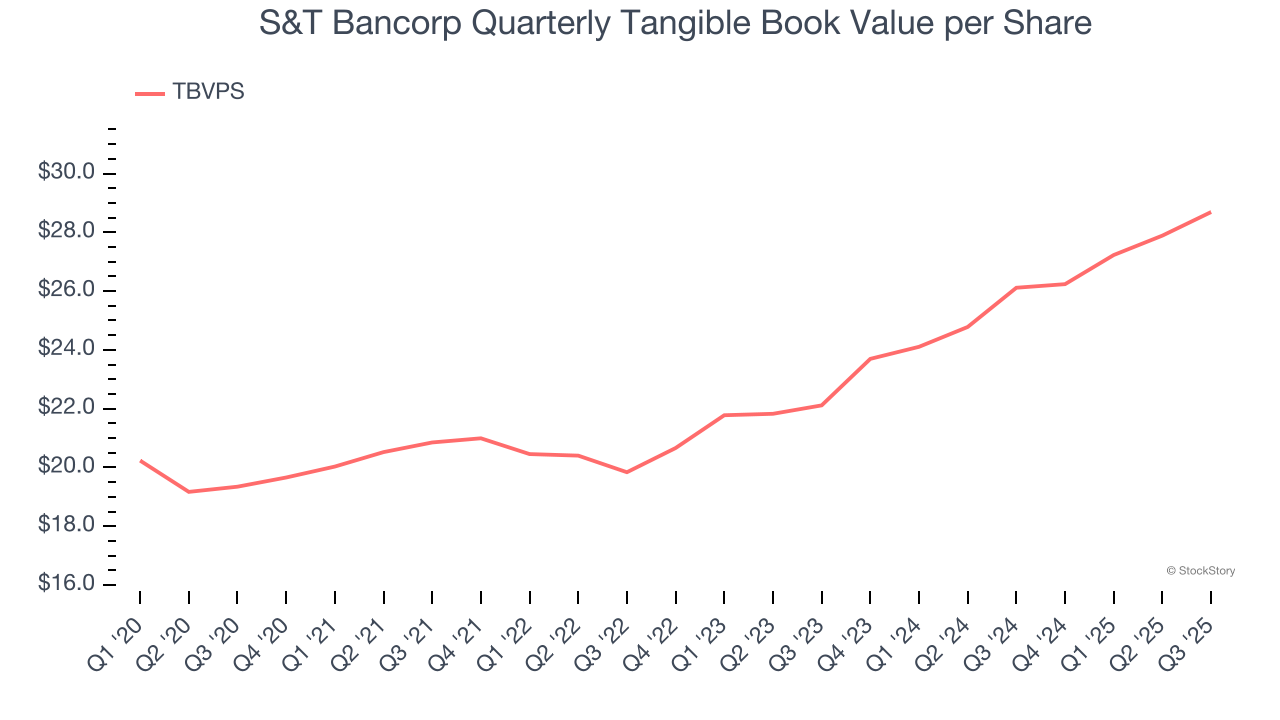
Over the next 12 months, Consensus estimates call for S&T Bancorp’s TBVPS to grow by 6.7% to $30.61, mediocre growth rate.
Key Takeaways from S&T Bancorp’s Q3 Results
It was good to see S&T Bancorp narrowly top analysts’ tangible book value per share expectations this quarter.Zooming out, we think this was a decent quarter. The stock traded up 1.9% to $36.33 immediately after reporting.
So do we think S&T Bancorp is an attractive buy at the current price? What happened in the latest quarter matters, but not as much as longer-term business quality and valuation, when deciding whether to invest in this stock. We cover that in our actionable full research report which you can read here, it’s free for active Edge members.