
Regional banking company WSFS Financial (NASDAQ: WSFS) announced better-than-expected revenue in Q3 CY2025, with sales up 1.1% year on year to $270.5 million. Its GAAP profit of $1.37 per share was 9.4% above analysts’ consensus estimates.
Is now the time to buy WSFS Financial? Find out by accessing our full research report, it’s free for active Edge members.
WSFS Financial (WSFS) Q3 CY2025 Highlights:
- Net Interest Income: $184 million vs analyst estimates of $180.2 million (3.7% year-on-year growth, 2.1% beat)
- Net Interest Margin: 3.9% vs analyst estimates of 3.9% (5.5 basis point beat)
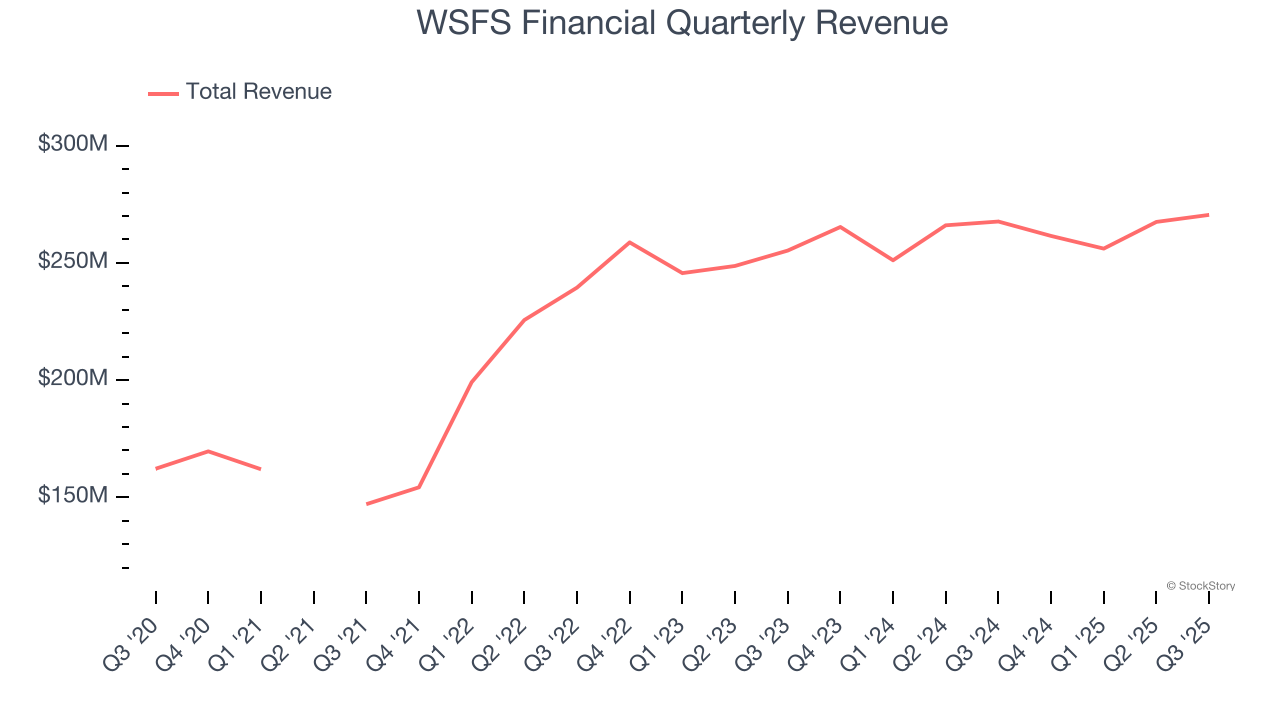
- Revenue: $270.5 million vs analyst estimates of $268.1 million (1.1% year-on-year growth, 0.9% beat)
- Efficiency Ratio: 60.2% vs analyst estimates of 60.5% (33 basis point beat)
- EPS (GAAP): $1.37 vs analyst estimates of $1.25 (9.4% beat)
- Tangible Book Value per Share: $32.11 vs analyst estimates of $31.05 (12.1% year-on-year growth, 3.4% beat)
- Market Capitalization: $2.95 billion
Company Overview
Founded in 1832 as Wilmington Savings Fund Society and one of the oldest banks in America still operating under its original name, WSFS Financial (NASDAQ: WSFS) operates a community banking and wealth management franchise primarily serving customers in the Mid-Atlantic region through its main subsidiary, WSFS Bank.
Sales Growth
In general, banks make money from two primary sources. The first is net interest income, which is interest earned on loans, mortgages, and investments in securities minus interest paid out on deposits. The second source is non-interest income, which can come from bank account, credit card, wealth management, investing banking, and trading fees. Thankfully, WSFS Financial’s 10% annualized revenue growth over the last five years was impressive. Its growth beat the average banking company and shows its offerings resonate with customers, a helpful starting point for our analysis.
 Note: Quarters not shown were determined to be outliers, impacted by outsized investment gains/losses that are not indicative of the recurring fundamentals of the business.
Long-term growth is the most important, but within financials, a half-decade historical view may miss recent interest rate changes and market returns. WSFS Financial’s recent performance shows its demand has slowed significantly as its annualized revenue growth of 2.3% over the last two years was well below its five-year trend. 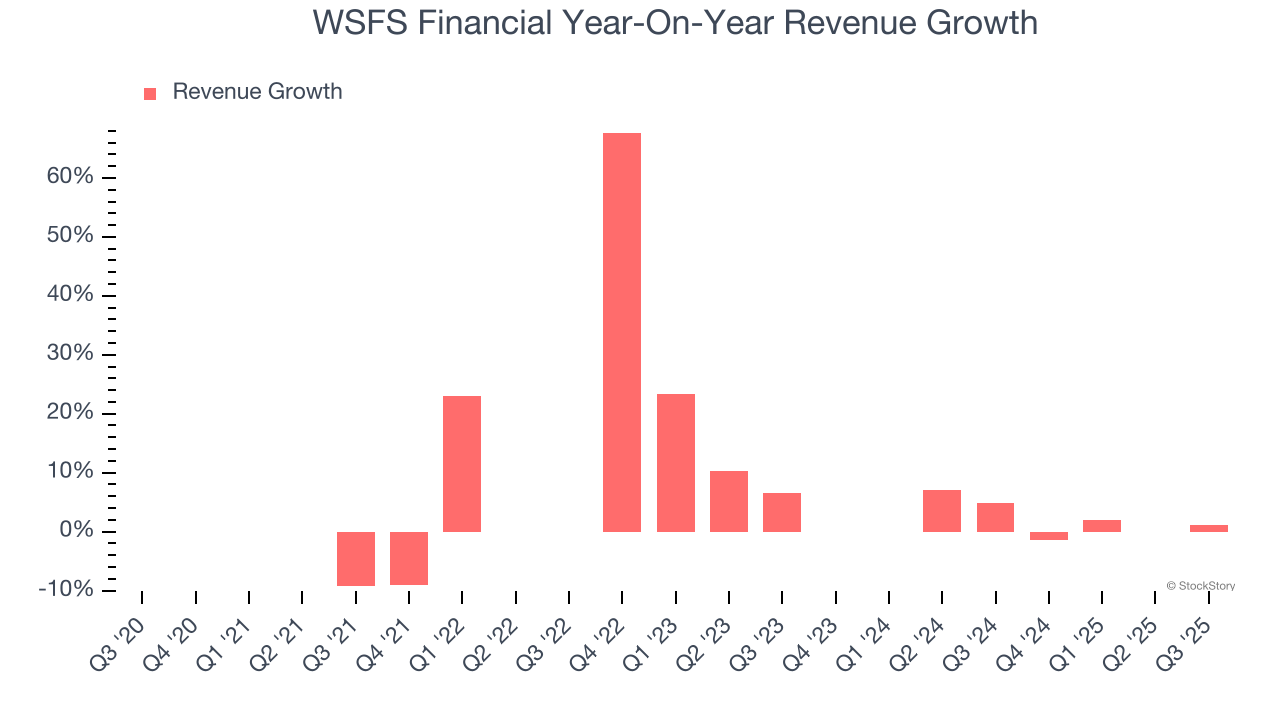 Note: Quarters not shown were determined to be outliers, impacted by outsized investment gains/losses that are not indicative of the recurring fundamentals of the business.
This quarter, WSFS Financial reported modest year-on-year revenue growth of 1.1% but beat Wall Street’s estimates by 0.9%.
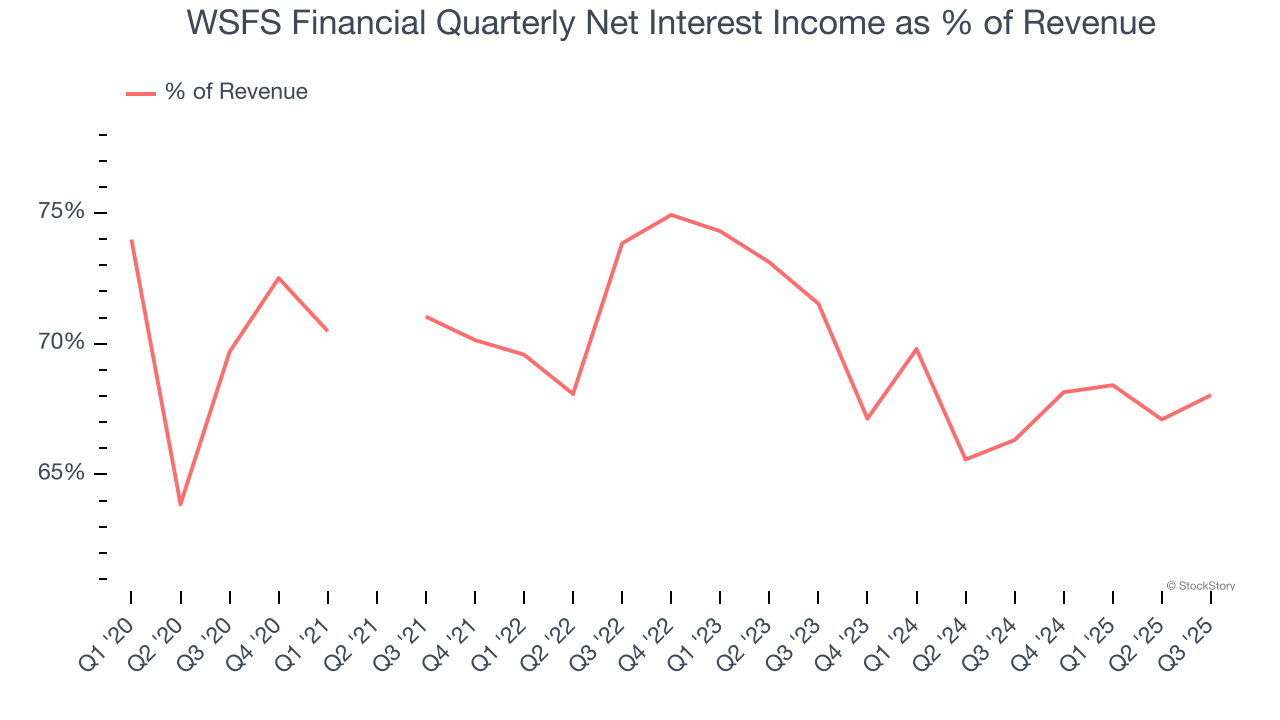
Since the company recorded losses on certain securities, it generated more net interest income than revenue (a 34.9x multiple of its revenue to be exact) during the last five years, meaning WSFS Financial lives and dies by its lending activities because non-interest income barely moves the needle.
 Note: Quarters not shown were determined to be outliers, impacted by outsized investment gains/losses that are not indicative of the recurring fundamentals of the business.
Markets consistently prioritize net interest income growth over fee-based revenue, recognizing its superior quality and recurring nature compared to the more unpredictable non-interest income streams.
Here at StockStory, we certainly understand the potential of thematic investing. Diverse winners from Microsoft (MSFT) to Alphabet (GOOG), Coca-Cola (KO) to Monster Beverage (MNST) could all have been identified as promising growth stories with a megatrend driving the growth. So, in that spirit, we’ve identified a relatively under-the-radar profitable growth stock benefiting from the rise of AI, available to you FREE via this link.
Tangible Book Value Per Share (TBVPS)
The balance sheet drives banking profitability since earnings flow from the spread between borrowing and lending rates. As such, valuations for these companies concentrate on capital strength and sustainable equity accumulation potential.
This is why we consider tangible book value per share (TBVPS) the most important metric to track for banks. TBVPS represents the real, liquid net worth per share of a bank, excluding intangible assets that have debatable value upon liquidation. EPS can become murky due to acquisition impacts or accounting flexibility around loan provisions, and TBVPS resists financial engineering manipulation.
WSFS Financial’s TBVPS grew at a mediocre 4.5% annual clip over the last five years. However, TBVPS growth has accelerated recently, growing by 25.4% annually over the last two years from $20.42 to $32.11 per share.
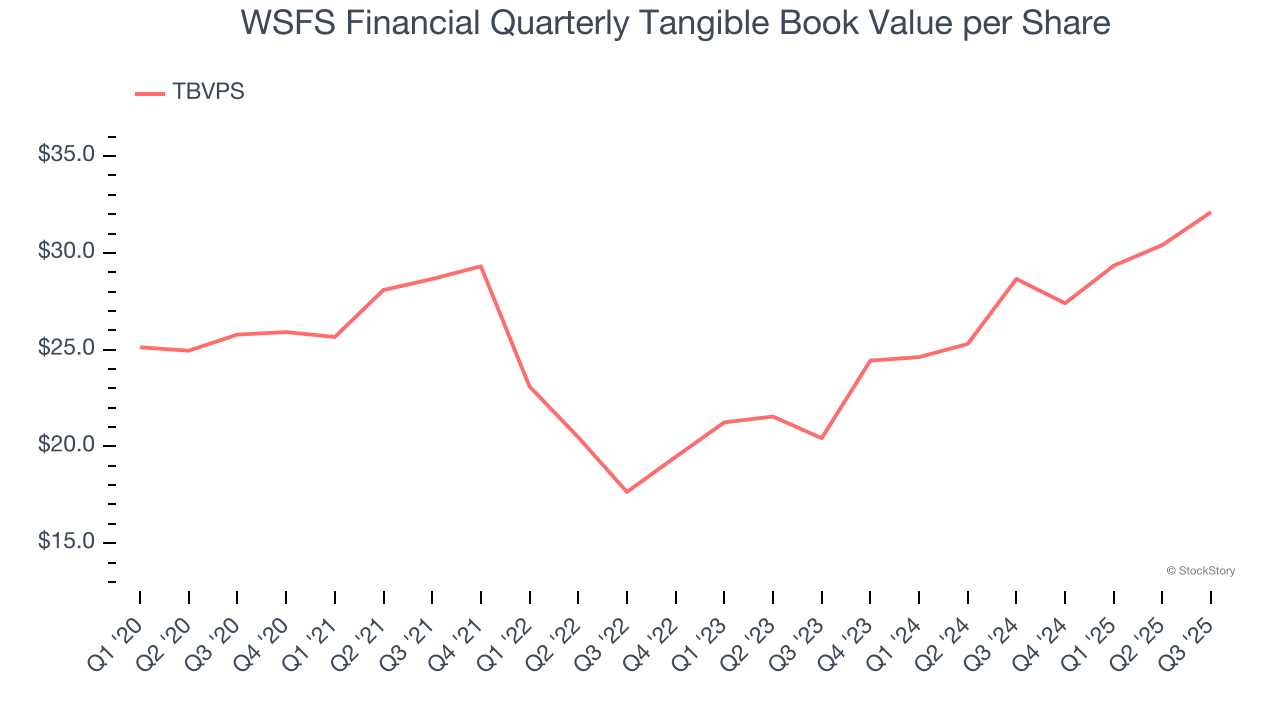
Over the next 12 months, Consensus estimates call for WSFS Financial’s TBVPS to grow by 10.1% to $35.37, solid growth rate.
Key Takeaways from WSFS Financial’s Q3 Results
We enjoyed seeing WSFS Financial beat analysts’ tangible book value per share expectations this quarter. We were also happy its net interest income outperformed Wall Street’s estimates. Overall, we think this was a solid quarter with some key areas of upside. The stock remained flat at $52.80 immediately following the results.
Sure, WSFS Financial had a solid quarter, but if we look at the bigger picture, is this stock a buy? When making that decision, it’s important to consider its valuation, business qualities, as well as what has happened in the latest quarter. We cover that in our actionable full research report which you can read here, it’s free for active Edge members.