
Over the last six months, Cracker Barrel’s shares have sunk to $36.92, producing a disappointing 14.6% loss - a stark contrast to the S&P 500’s 22.9% gain. This may have investors wondering how to approach the situation.
Is there a buying opportunity in Cracker Barrel, or does it present a risk to your portfolio? Check out our in-depth research report to see what our analysts have to say, it’s free for active Edge members.
Why Do We Think Cracker Barrel Will Underperform?
Even with the cheaper entry price, we're swiping left on Cracker Barrel for now. Here are three reasons you should be careful with CBRL and a stock we'd rather own.
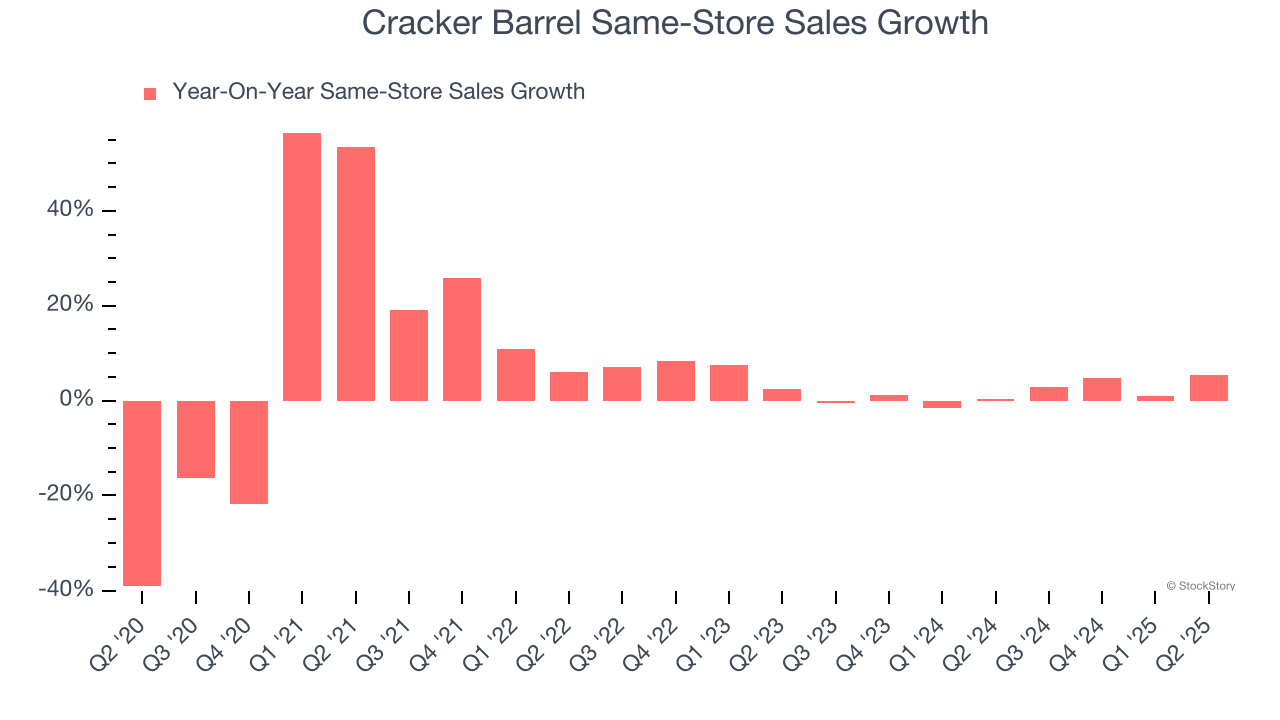
1. Same-Store Sales Falling Behind Peers
Same-store sales is a key performance indicator used to measure organic growth at restaurants open for at least a year.
Cracker Barrel’s demand within its existing dining locations has been relatively stable over the last two years but was below most restaurant chains. On average, the company’s same-store sales have grown by 1.7% per year.
2. Revenue Projections Show Stormy Skies Ahead
Forecasted revenues by Wall Street analysts signal a company’s potential. Predictions may not always be accurate, but accelerating growth typically boosts valuation multiples and stock prices while slowing growth does the opposite.
Over the next 12 months, sell-side analysts expect Cracker Barrel’s revenue to drop by 2.4%, a decrease from This projection doesn't excite us and suggests its menu offerings will face some demand challenges.
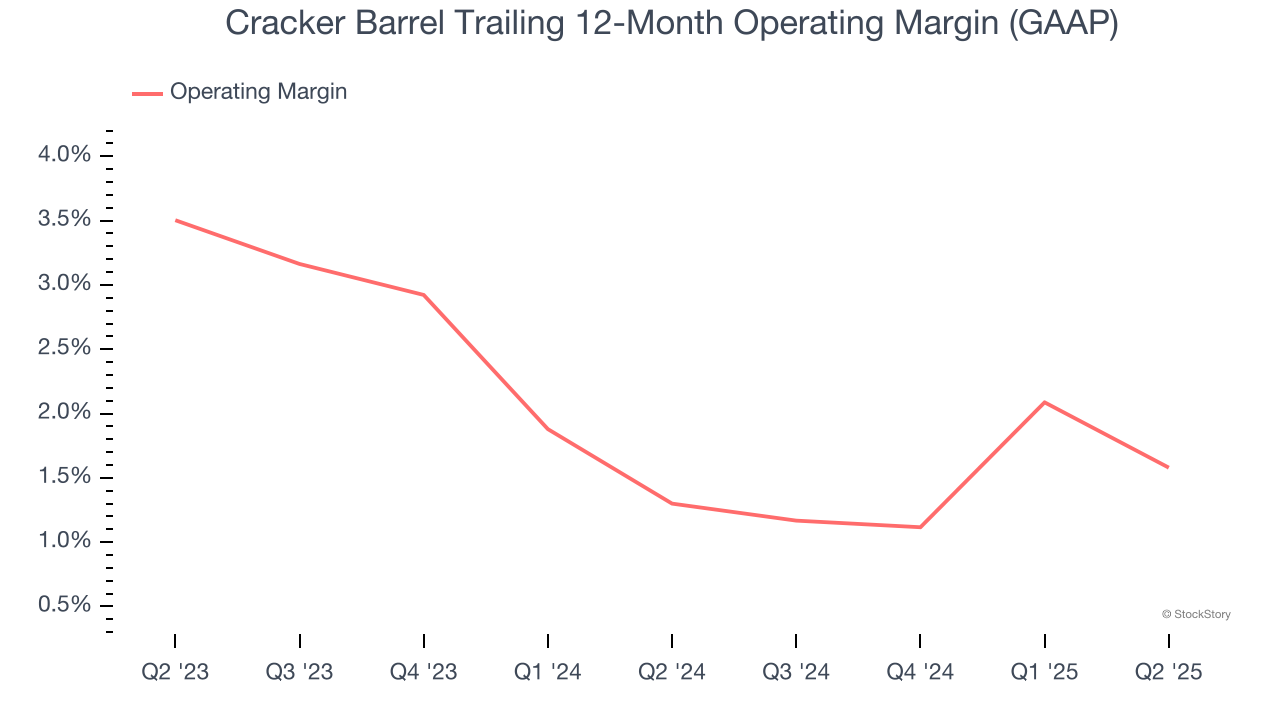
3. Weak Operating Margin Could Cause Trouble
Operating margin is an important measure of profitability for restaurants as it accounts for all expenses keeping the business in motion, including food costs, wages, rent, advertising, and other administrative costs.
Cracker Barrel’s operating margin might fluctuated slightly over the last 12 months but has remained more or less the same, averaging 1.4% over the last two years. This profitability was inadequate for a restaurant business and caused by its suboptimal cost structure.
Final Judgment
We cheer for all companies serving everyday consumers, but in the case of Cracker Barrel, we’ll be cheering from the sidelines. Following the recent decline, the stock trades at 42.8× forward P/E (or $36.92 per share). At this valuation, there’s a lot of good news priced in - we think there are better opportunities elsewhere. Let us point you toward one of Charlie Munger’s all-time favorite businesses.
Stocks We Would Buy Instead of Cracker Barrel
When Trump unveiled his aggressive tariff plan in April 2025, markets tanked as investors feared a full-blown trade war. But those who panicked and sold missed the subsequent rebound that’s already erased most losses.
Don’t let fear keep you from great opportunities and take a look at Top 5 Growth Stocks for this month. This is a curated list of our High Quality stocks that have generated a market-beating return of 183% over the last five years (as of March 31st 2025).
Stocks that made our list in 2020 include now familiar names such as Nvidia (+1,545% between March 2020 and March 2025) as well as under-the-radar businesses like the once-micro-cap company Tecnoglass (+1,754% five-year return). Find your next big winner with StockStory today.
StockStory is growing and hiring equity analyst and marketing roles. Are you a 0 to 1 builder passionate about the markets and AI? See the open roles here.


