
While the S&P 500 is up 22.9% since April 2025, Elastic (currently trading at $87.16 per share) has lagged behind, posting a return of 6.1%. This might have investors contemplating their next move.
Is there a buying opportunity in Elastic, or does it present a risk to your portfolio? Get the full breakdown from our expert analysts, it’s free for active Edge members.
Why Is Elastic Not Exciting?
We're cautious about Elastic. Here are three reasons there are better opportunities than ESTC and a stock we'd rather own.
1. Projected Revenue Growth Is Slim
Forecasted revenues by Wall Street analysts signal a company’s potential. Predictions may not always be accurate, but accelerating growth typically boosts valuation multiples and stock prices while slowing growth does the opposite.
Over the next 12 months, sell-side analysts expect Elastic’s revenue to rise by 12.5%, a deceleration versus its 27.1% annualized growth for the past five years. This projection doesn't excite us and implies its products and services will see some demand headwinds.
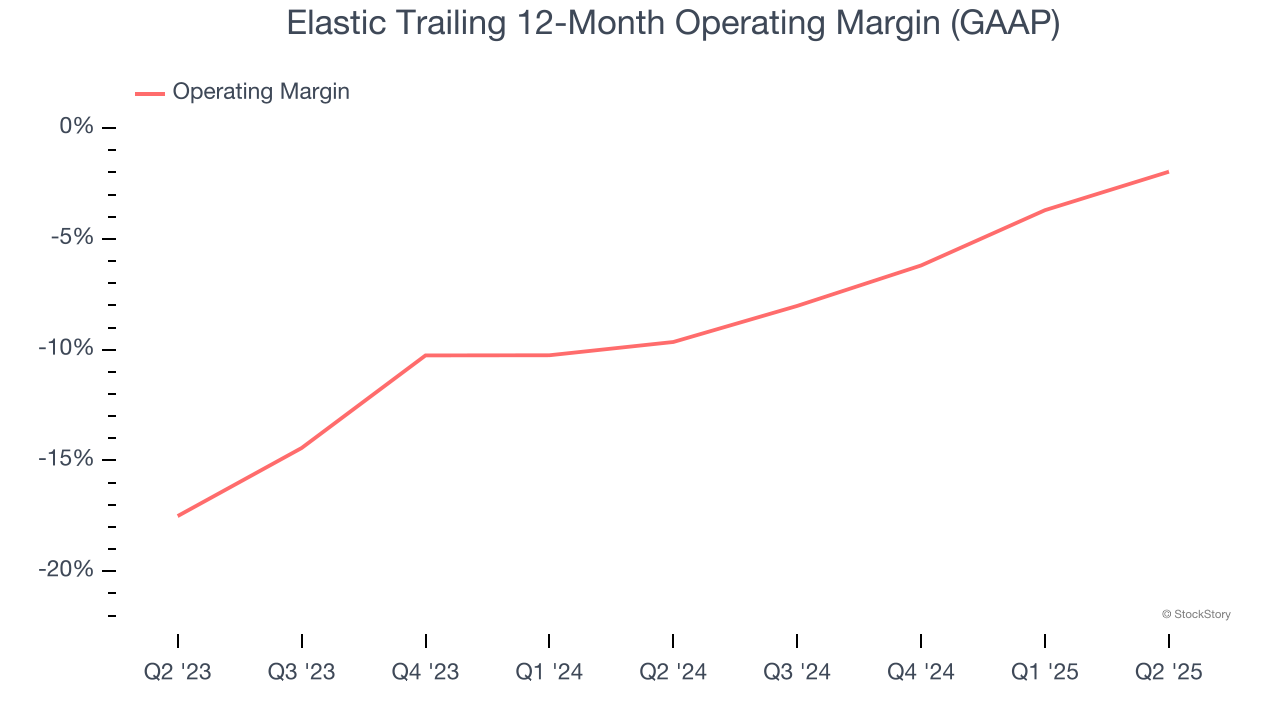
2. Operating Margin Rising, Profits Up
While many software businesses point investors to their adjusted profits, which exclude stock-based compensation (SBC), we prefer GAAP operating margin because SBC is a legitimate expense used to attract and retain talent. This metric shows how much revenue remains after accounting for all core expenses – everything from the cost of goods sold to sales and R&D.
Over the last two years, Elastic’s expanding sales gave it operating leverage as its margin rose by 7.7 percentage points. Its operating margin for the trailing 12 months was negative 2%, and it must keep making strides to one day reach sustainable profitability.
3. Cash Flow Margin Set to Decline
If you’ve followed StockStory for a while, you know we emphasize free cash flow. Why, you ask? We believe that in the end, cash is king, and you can’t use accounting profits to pay the bills.
Over the next year, analysts predict Elastic’s cash conversion will fall. Their consensus estimates imply its free cash flow margin of 20.2% for the last 12 months will decrease to 18.7%.
Final Judgment
Elastic’s business quality ultimately falls short of our standards. With its shares trailing the market in recent months, the stock trades at 5.3× forward price-to-sales (or $87.16 per share). This valuation is reasonable, but the company’s shakier fundamentals present too much downside risk. We're fairly confident there are better stocks to buy right now. We’d recommend looking at an all-weather company that owns household favorite Taco Bell.
High-Quality Stocks for All Market Conditions
Trump’s April 2025 tariff bombshell triggered a massive market selloff, but stocks have since staged an impressive recovery, leaving those who panic sold on the sidelines.
Take advantage of the rebound by checking out our Top 6 Stocks for this week. This is a curated list of our High Quality stocks that have generated a market-beating return of 183% over the last five years (as of March 31st 2025).
Stocks that made our list in 2020 include now familiar names such as Nvidia (+1,545% between March 2020 and March 2025) as well as under-the-radar businesses like the once-micro-cap company Kadant (+351% five-year return). Find your next big winner with StockStory today.
StockStory is growing and hiring equity analyst and marketing roles. Are you a 0 to 1 builder passionate about the markets and AI? See the open roles here.


