Jazz Pharmaceuticals trades at $138.50 and has moved in lockstep with the market. Its shares have returned 27.1% over the last six months while the S&P 500 has gained 22.9%.
Is there a buying opportunity in Jazz Pharmaceuticals, or does it present a risk to your portfolio? Dive into our full research report to see our analyst team’s opinion, it’s free for active Edge members.
Why Do We Think Jazz Pharmaceuticals Will Underperform?
We're swiping left on Jazz Pharmaceuticals for now. Here are three reasons we avoid JAZZ and a stock we'd rather own.
1. Lackluster Revenue Growth
We at StockStory place the most emphasis on long-term growth, but within healthcare, a stretched historical view may miss recent innovations or disruptive industry trends. Jazz Pharmaceuticals’s recent performance shows its demand has slowed as its annualized revenue growth of 4.2% over the last two years was below its five-year trend. 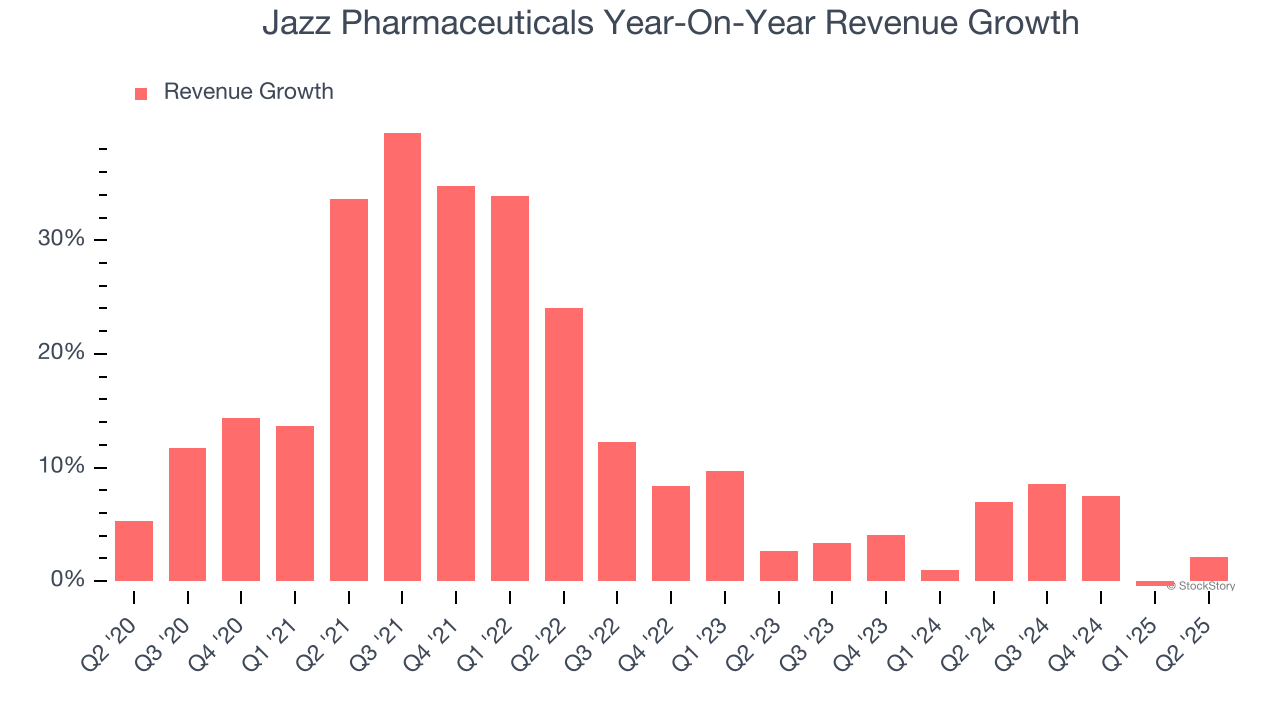
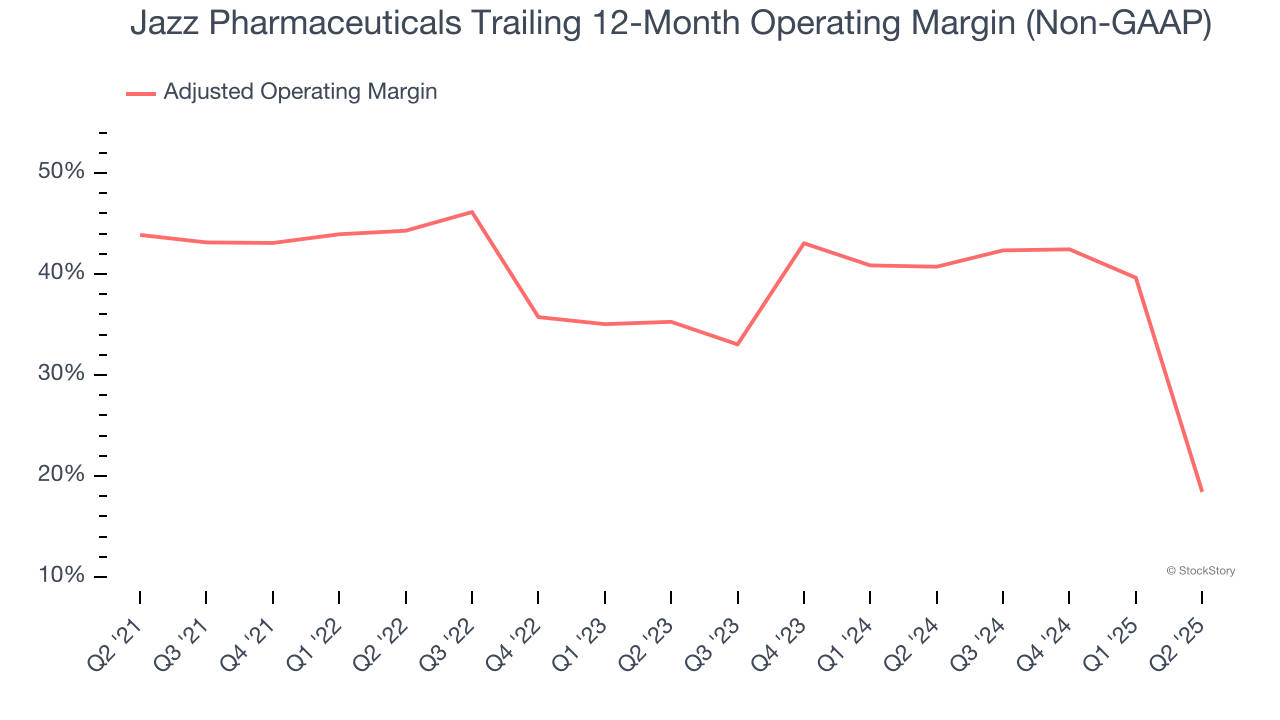
2. Shrinking Adjusted Operating Margin
Adjusted operating margin is a key measure of profitability. Think of it as net income (the bottom line) excluding the impact of non-recurring expenses, taxes, and interest on debt - metrics less connected to business fundamentals.
Looking at the trend in its profitability, Jazz Pharmaceuticals’s adjusted operating margin decreased by 25.4 percentage points over the last five years. This raises questions about the company’s expense base because its revenue growth should have given it leverage on its fixed costs, resulting in better economies of scale and profitability. Its adjusted operating margin for the trailing 12 months was 18.4%.
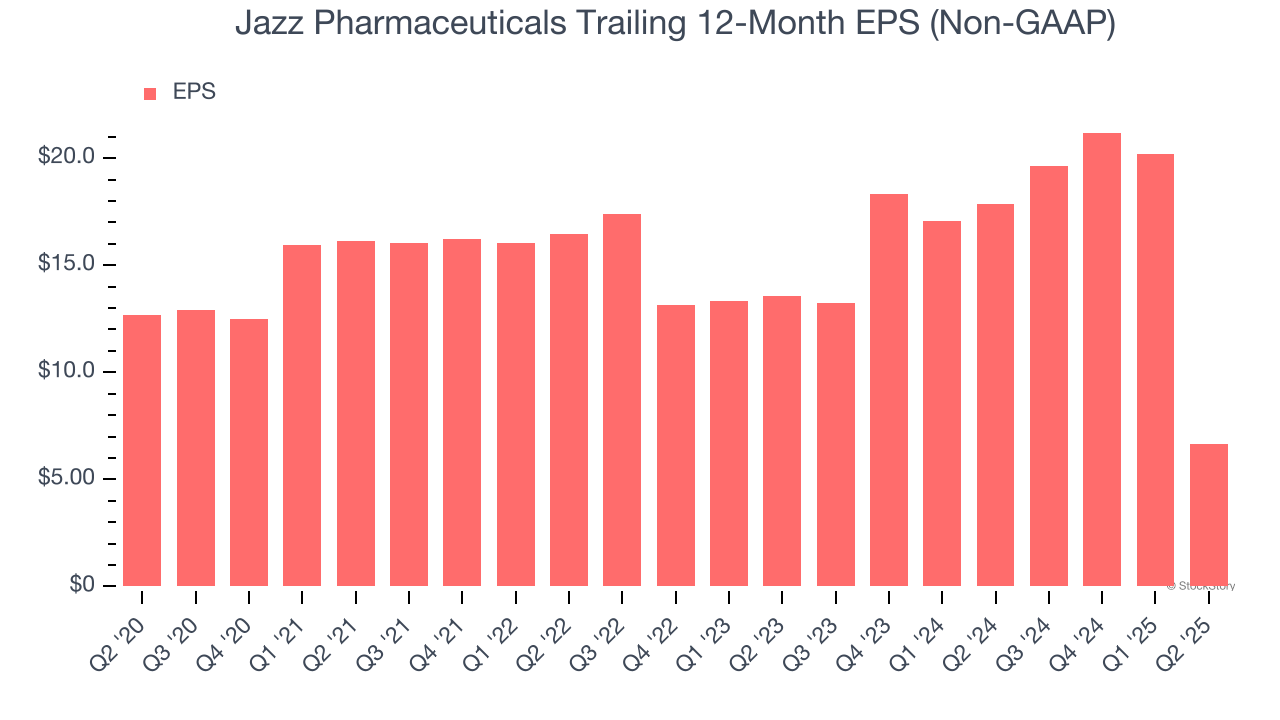
3. EPS Trending Down
Analyzing the long-term change in earnings per share (EPS) shows whether a company's incremental sales were profitable – for example, revenue could be inflated through excessive spending on advertising and promotions.
Sadly for Jazz Pharmaceuticals, its EPS declined by 12.1% annually over the last five years while its revenue grew by 13%. This tells us the company became less profitable on a per-share basis as it expanded.
Final Judgment
Jazz Pharmaceuticals doesn’t pass our quality test. That said, the stock currently trades at 6.6× forward P/E (or $138.50 per share). While this valuation is optically cheap, the potential downside is huge given its shaky fundamentals. There are better investments elsewhere. We’d suggest looking at one of our top software and edge computing picks.
High-Quality Stocks for All Market Conditions
Donald Trump’s April 2025 "Liberation Day" tariffs sent markets into a tailspin, but stocks have since rebounded strongly, proving that knee-jerk reactions often create the best buying opportunities.
The smart money is already positioning for the next leg up. Don’t miss out on the recovery - check out our Top 9 Market-Beating Stocks. This is a curated list of our High Quality stocks that have generated a market-beating return of 183% over the last five years (as of March 31st 2025).
Stocks that made our list in 2020 include now familiar names such as Nvidia (+1,545% between March 2020 and March 2025) as well as under-the-radar businesses like the once-micro-cap company Kadant (+351% five-year return). Find your next big winner with StockStory today.
StockStory is growing and hiring equity analyst and marketing roles. Are you a 0 to 1 builder passionate about the markets and AI? See the open roles here.