
The past six months have been a windfall for Elanco’s shareholders. The company’s stock price has jumped 127%, hitting $21.47 per share. This was partly due to its solid quarterly results, and the performance may have investors wondering how to approach the situation.
Is there a buying opportunity in Elanco, or does it present a risk to your portfolio? Get the full stock story straight from our expert analysts, it’s free for active Edge members.
Why Is Elanco Not Exciting?
Despite the momentum, we don't have much confidence in Elanco. Here are three reasons we avoid ELAN and a stock we'd rather own.
1. Lackluster Revenue Growth
We at StockStory place the most emphasis on long-term growth, but within healthcare, a stretched historical view may miss recent innovations or disruptive industry trends. Elanco’s recent performance shows its demand has slowed as its annualized revenue growth of 1.8% over the last two years was below its five-year trend. 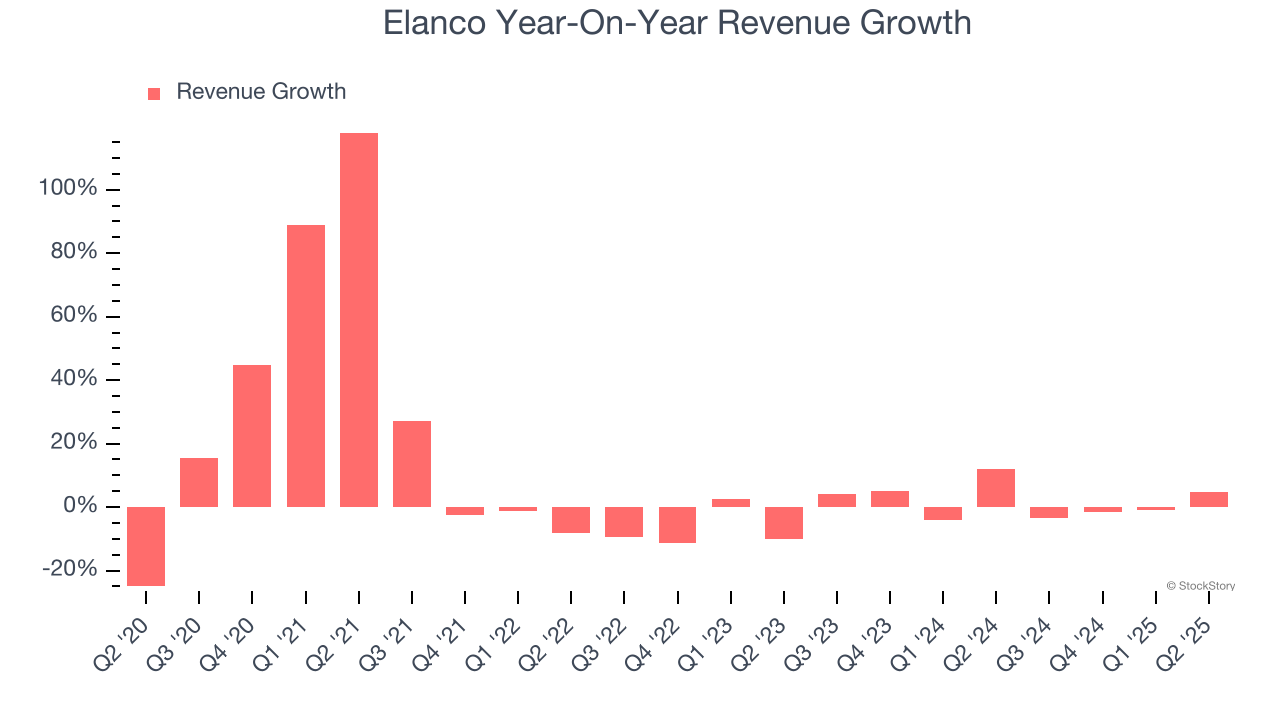
2. Weak Constant Currency Growth Points to Soft Demand
In addition to reported revenue, constant currency revenue is a useful data point for analyzing Specialty Pharmaceuticals companies. This metric excludes currency movements, which are outside of Elanco’s control and are not indicative of underlying demand.
Over the last two years, Elanco’s constant currency revenue averaged 4.1% year-on-year growth. This performance slightly lagged the sector and suggests it might have to lower prices or invest in product improvements to accelerate growth, factors that can hinder near-term profitability. 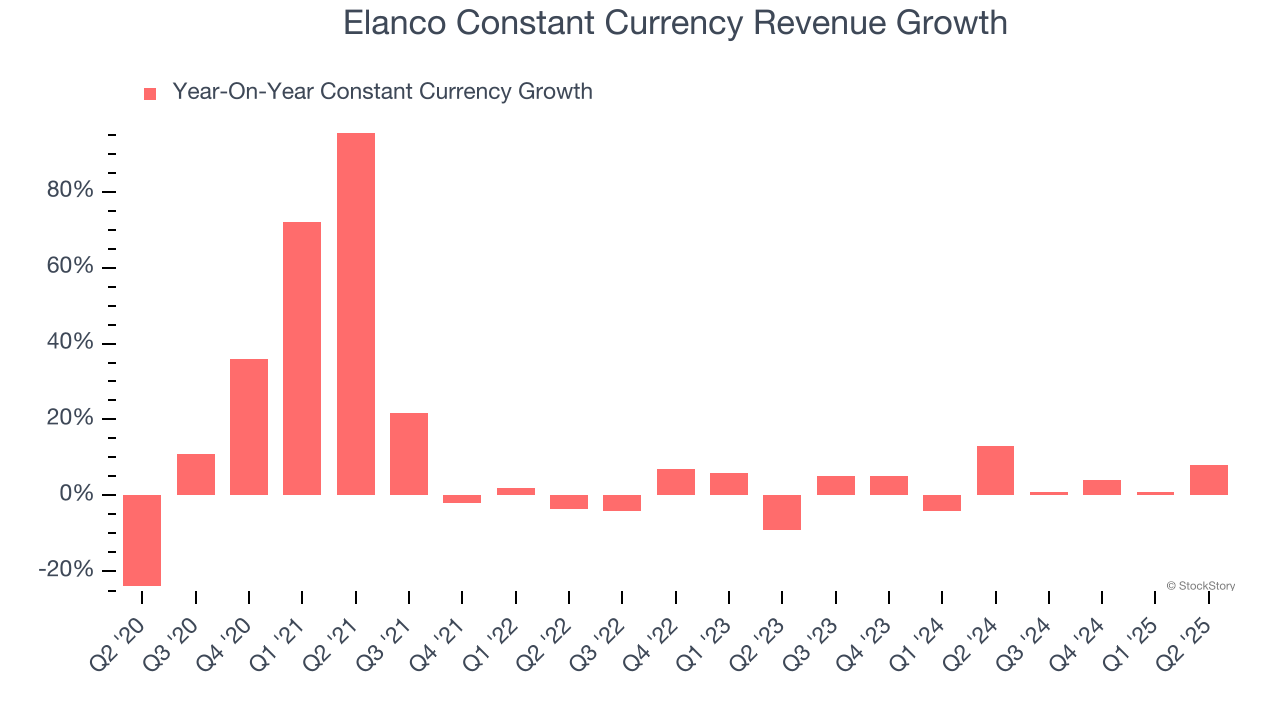
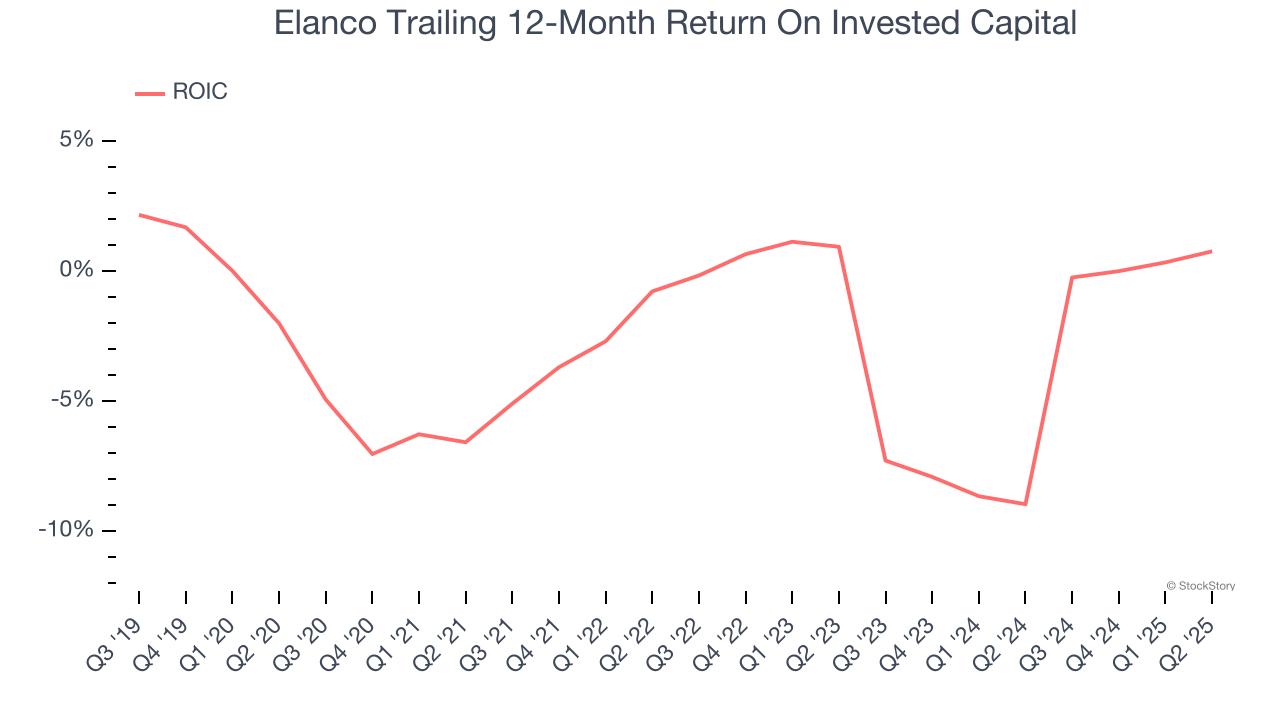
3. Previous Growth Initiatives Have Lost Money
Growth gives us insight into a company’s long-term potential, but how capital-efficient was that growth? Enter ROIC, a metric showing how much operating profit a company generates relative to the money it has raised (debt and equity).
Elanco’s five-year average ROIC was negative 2.9%, meaning management lost money while trying to expand the business. Its returns were among the worst in the healthcare sector.
Final Judgment
Elanco isn’t a terrible business, but it isn’t one of our picks. After the recent rally, the stock trades at 23.8× forward P/E (or $21.47 per share). Beauty is in the eye of the beholder, but our analysis shows the upside isn’t great compared to the potential downside. We're fairly confident there are better stocks to buy right now. We’d recommend looking at the most entrenched endpoint security platform on the market.
High-Quality Stocks for All Market Conditions
Donald Trump’s April 2025 "Liberation Day" tariffs sent markets into a tailspin, but stocks have since rebounded strongly, proving that knee-jerk reactions often create the best buying opportunities.
The smart money is already positioning for the next leg up. Don’t miss out on the recovery - check out our Top 5 Growth Stocks for this month. This is a curated list of our High Quality stocks that have generated a market-beating return of 183% over the last five years (as of March 31st 2025).
Stocks that made our list in 2020 include now familiar names such as Nvidia (+1,545% between March 2020 and March 2025) as well as under-the-radar businesses like the once-small-cap company Exlservice (+354% five-year return). Find your next big winner with StockStory today.
StockStory is growing and hiring equity analyst and marketing roles. Are you a 0 to 1 builder passionate about the markets and AI? See the open roles here.


