
Regional banking company Flagstar Financial (NYSE: FLG) beat Wall Street’s revenue expectations in Q3 CY2025, but sales fell by 16.7% year on year to $519 million. Its non-GAAP loss of $0.07 per share was in line with analysts’ consensus estimates.
Is now the time to buy Flagstar Financial? Find out by accessing our full research report, it’s free for active Edge members.
Flagstar Financial (FLG) Q3 CY2025 Highlights:
- Net Interest Income: $425 million vs analyst estimates of $430.6 million (16.7% year-on-year decline, 1.3% miss)
- Net Interest Margin: 1.9% vs analyst estimates of 1.9% (in line)
- Revenue: $519 million vs analyst estimates of $516.4 million (16.7% year-on-year decline, 0.5% beat)
- Efficiency Ratio: 100% vs analyst estimates of 92.2% (824 basis point miss)
- Adjusted EPS: -$0.07 vs analyst estimates of -$0.07 (in line)
- Tangible Book Value per Share: $17.32 vs analyst estimates of $17.20 (4.7% year-on-year decline, 0.7% beat)
- Market Capitalization: $4.80 billion
Commenting on the Company's third quarter 2025 performance, Chairman, President, and Chief Executive Officer, Joseph M. Otting stated, "Our third-quarter 2025 performance provides further evidence that we are successfully executing on each of our strategic priorities, which we first outlined during the first quarter of last year. Our operating results improved significantly during the quarter as key balance sheet and income statement metrics continue to trend positively.
Company Overview
Tracing its roots back to 1859 and rebranded from New York Community Bancorp in 2024, Flagstar Financial (NYSE: FLG) is a bank holding company that offers commercial and consumer banking services, with specialties in multi-family lending, mortgage originations, and warehouse lending.
Sales Growth
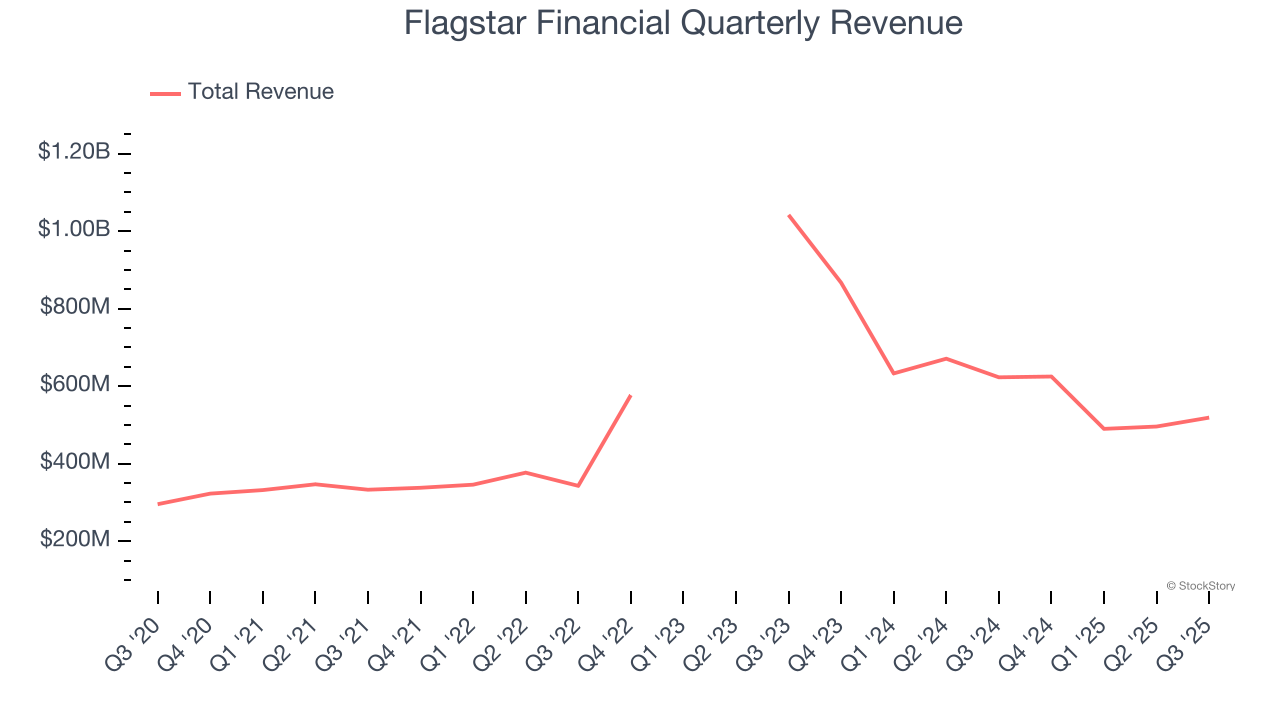
Net interest income and and fee-based revenue are the two pillars supporting bank earnings. The former captures profit from the gap between lending rates and deposit costs, while the latter encompasses charges for banking services, credit products, wealth management, and trading activities. Luckily, Flagstar Financial’s revenue grew at an exceptional 14.2% compounded annual growth rate over the last five years. Its growth beat the average banking company and shows its offerings resonate with customers.
 Note: Quarters not shown were determined to be outliers, impacted by outsized investment gains/losses that are not indicative of the recurring fundamentals of the business.
We at StockStory place the most emphasis on long-term growth, but within financials, a half-decade historical view may miss recent interest rate changes, market returns, and industry trends. Flagstar Financial’s recent performance marks a sharp pivot from its five-year trend as its revenue has shown annualized declines of 23.8% over the last two years. 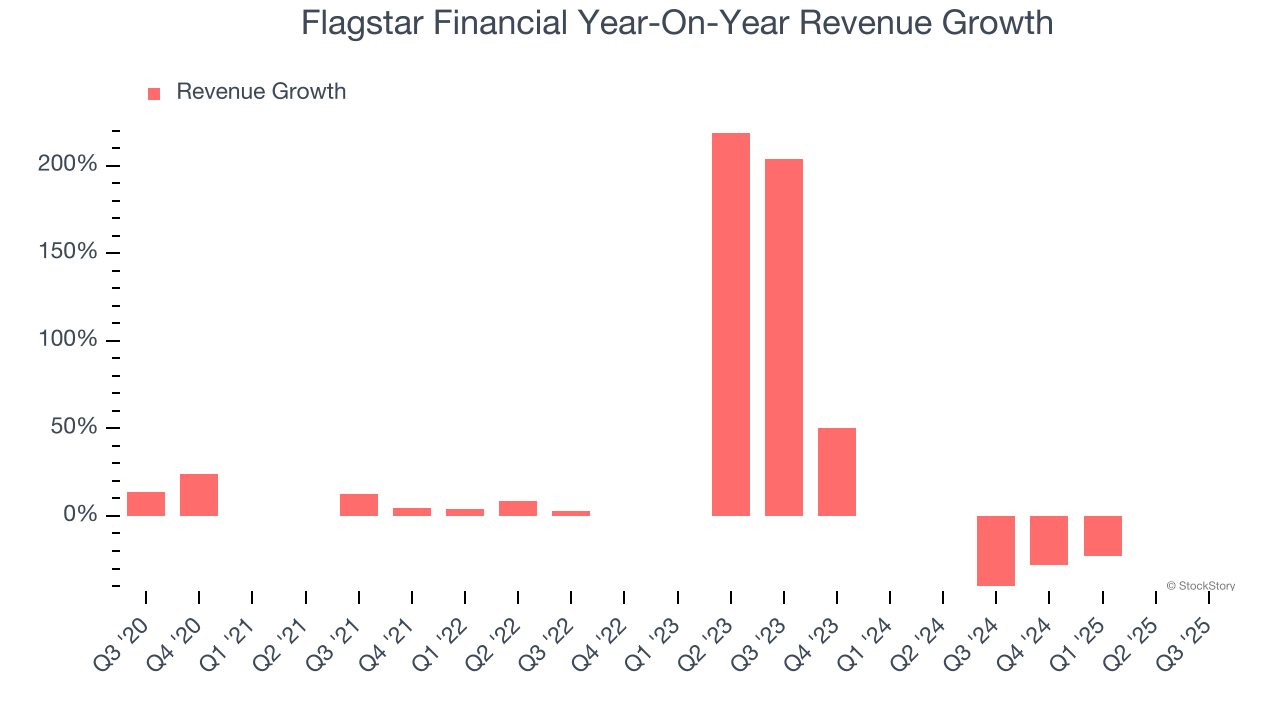 Note: Quarters not shown were determined to be outliers, impacted by outsized investment gains/losses that are not indicative of the recurring fundamentals of the business.
This quarter, Flagstar Financial’s revenue fell by 16.7% year on year to $519 million but beat Wall Street’s estimates by 0.5%.
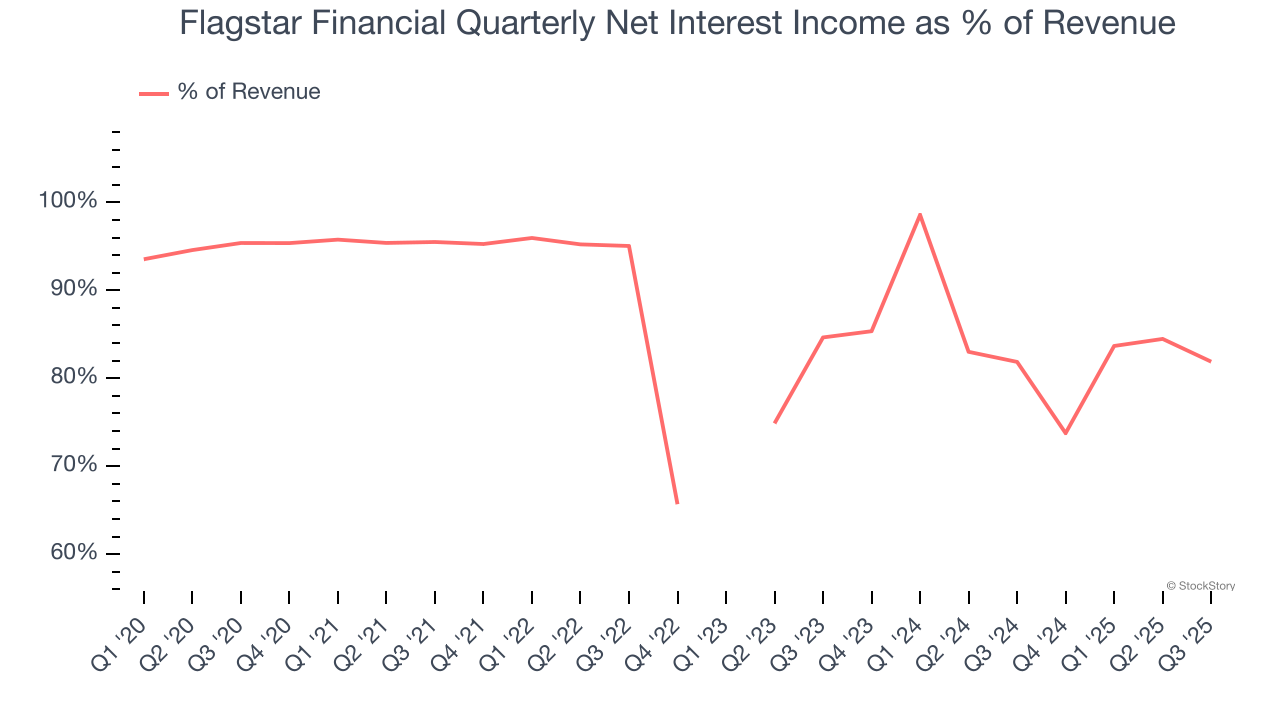
Net interest income made up 84.1% of the company’s total revenue during the last five years, meaning Flagstar Financial barely relies on non-interest income to drive its overall growth.
 Note: Quarters not shown were determined to be outliers, impacted by outsized investment gains/losses that are not indicative of the recurring fundamentals of the business.
While banks generate revenue from multiple sources, investors view net interest income as the cornerstone - its predictable, recurring characteristics stand in sharp contrast to the volatility of non-interest income.
Today’s young investors won’t have read the timeless lessons in Gorilla Game: Picking Winners In High Technology because it was written more than 20 years ago when Microsoft and Apple were first establishing their supremacy. But if we apply the same principles, then enterprise software stocks leveraging their own generative AI capabilities may well be the Gorillas of the future. So, in that spirit, we are excited to present our Special Free Report on a profitable, fast-growing enterprise software stock that is already riding the automation wave and looking to catch the generative AI next.
Tangible Book Value Per Share (TBVPS)
Banks are balance sheet-driven businesses because they generate earnings primarily through borrowing and lending. They’re also valued based on their balance sheet strength and ability to compound book value (another name for shareholders’ equity) over time.
This explains why tangible book value per share (TBVPS) stands as the premier banking metric. TBVPS strips away questionable intangible assets, revealing concrete per-share net worth that investors can trust. Traditional metrics like EPS are helpful but face distortion from M&A activity and loan loss accounting rules.
Flagstar Financial’s TBVPS declined at a 6.8% annual clip over the last five years. A turnaround doesn’t seem to be in sight as its TBVPS also dropped by 24.9% annually over the last two years ($30.74 to $17.32 per share).
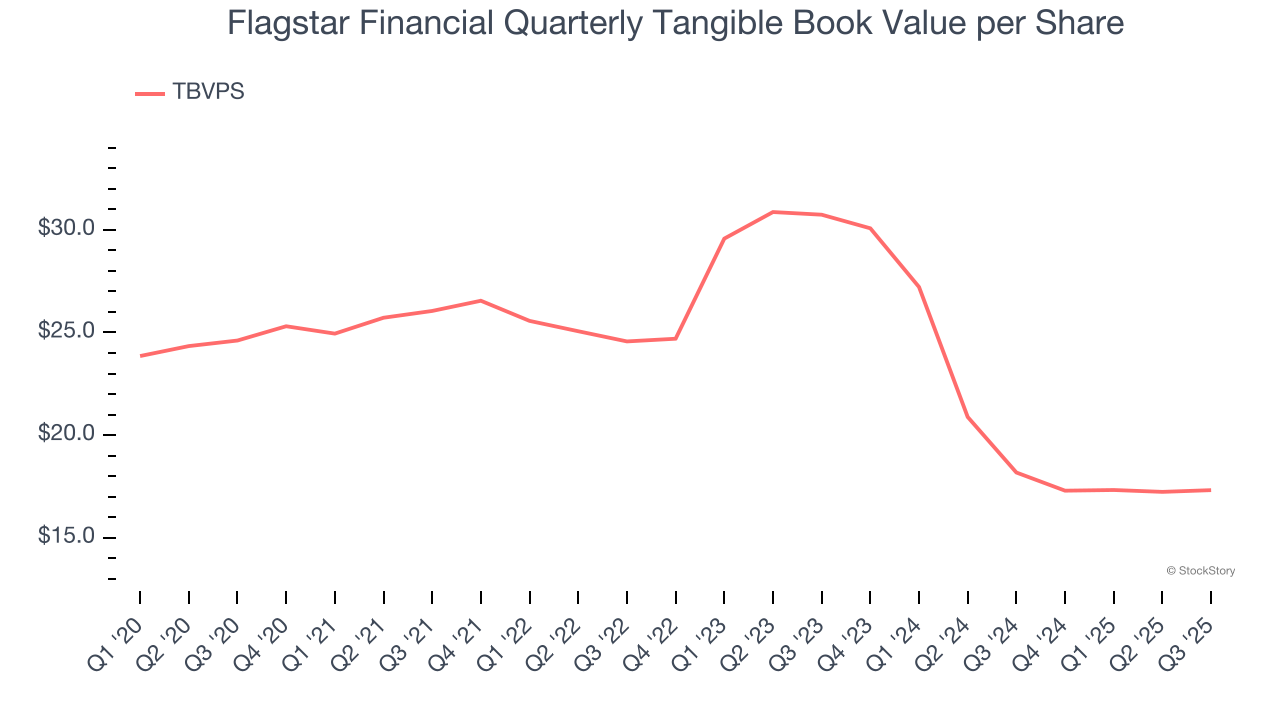
Over the next 12 months, Consensus estimates call for Flagstar Financial’s TBVPS to remain flat at roughly $17.21, a disappointing projection.
Key Takeaways from Flagstar Financial’s Q3 Results
It was good to see Flagstar Financial narrowly top analysts’ tangible book value per share expectations this quarter. We were also happy its revenue narrowly outperformed Wall Street’s estimates. On the other hand, its EPS was in line and its net interest income fell slightly short of Wall Street’s estimates. Overall, this was a mixed quarter. The stock remained flat at $11.65 immediately after reporting.
So should you invest in Flagstar Financial right now? When making that decision, it’s important to consider its valuation, business qualities, as well as what has happened in the latest quarter. We cover that in our actionable full research report which you can read here, it’s free for active Edge members.