
ZoomInfo trades at $11.12 per share and has stayed right on track with the overall market, gaining 27.7% over the last six months. At the same time, the S&P 500 has returned 22.9%.
Is there a buying opportunity in ZoomInfo, or does it present a risk to your portfolio? Check out our in-depth research report to see what our analysts have to say, it’s free for active Edge members.
Why Do We Think ZoomInfo Will Underperform?
We're swiping left on ZoomInfo for now. Here are three reasons you should be careful with GTM and a stock we'd rather own.
1. Weak Billings Point to Soft Demand
Billings is a non-GAAP metric that is often called “cash revenue” because it shows how much money the company has collected from customers in a certain period. This is different from revenue, which must be recognized in pieces over the length of a contract.
ZoomInfo’s billings came in at $294.6 million in Q2, and over the last four quarters, its year-on-year growth averaged 2.3%. This performance was underwhelming and suggests that increasing competition is causing challenges in acquiring/retaining customers. 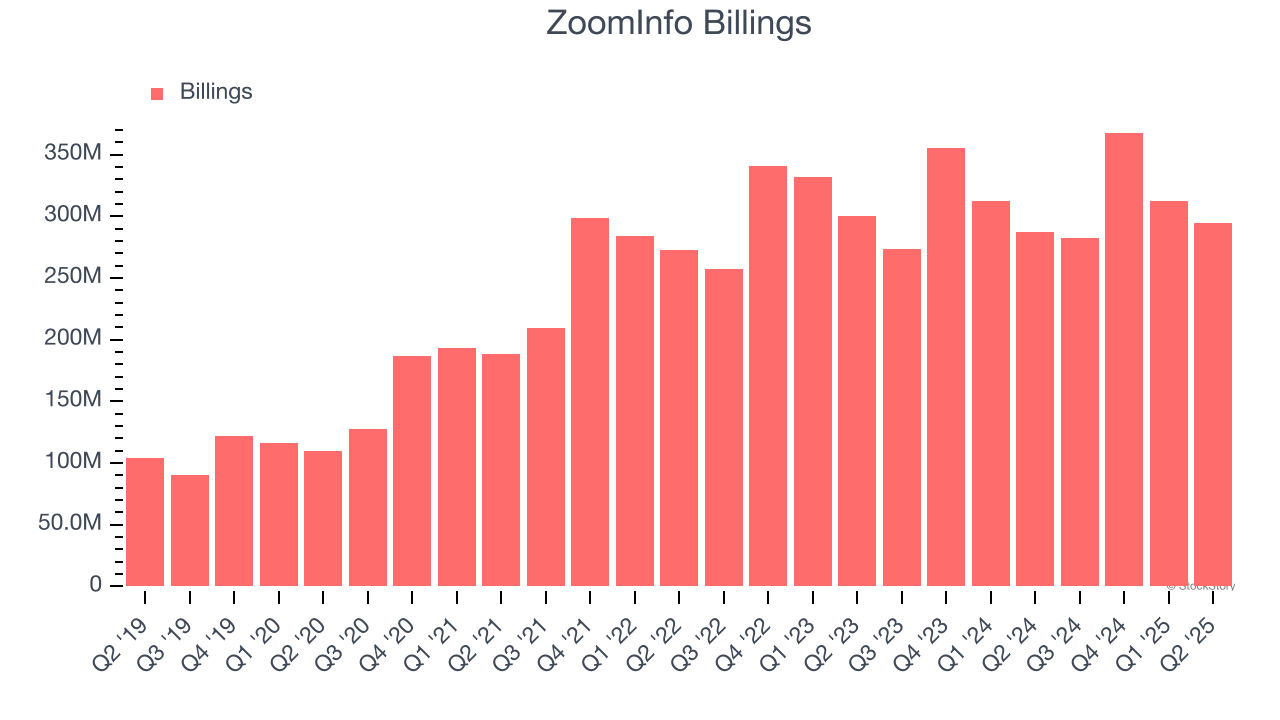
2. Projected Revenue Growth Shows Limited Upside
Forecasted revenues by Wall Street analysts signal a company’s potential. Predictions may not always be accurate, but accelerating growth typically boosts valuation multiples and stock prices while slowing growth does the opposite.
Over the next 12 months, sell-side analysts expect ZoomInfo’s revenue to stall, a slight deceleration versus its 26.2% annualized growth for the past five years. This projection doesn't excite us and suggests its products and services will face some demand challenges.
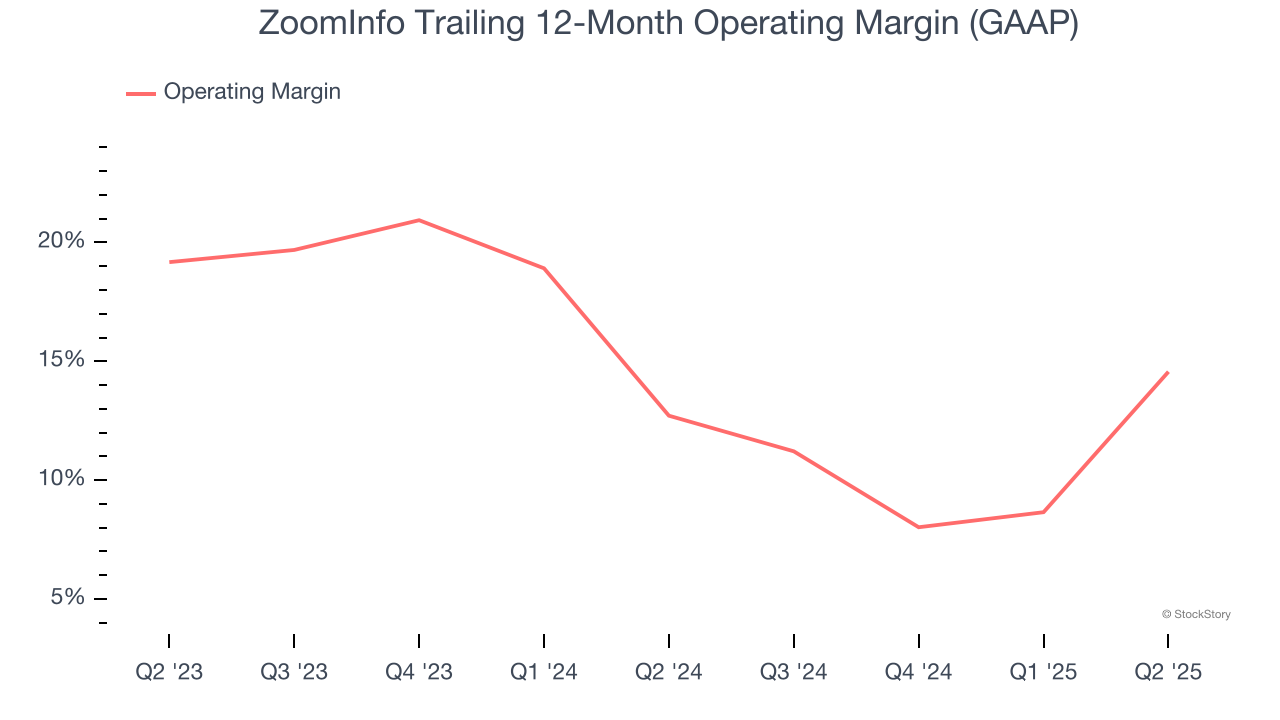
3. Operating Margin Rising, Profits Up
Many software businesses adjust their profits for stock-based compensation (SBC), but we prioritize GAAP operating margin because SBC is a real expense used to attract and retain engineering and sales talent. This is one of the best measures of profitability because it shows how much money a company takes home after developing, marketing, and selling its products.
Looking at the trend in its profitability, ZoomInfo’s operating margin rose by 1.8 percentage points over the last two years, as its sales growth gave it operating leverage. Its operating margin for the trailing 12 months was 14.6%.
Final Judgment
We see the value of companies addressing major business pain points, but in the case of ZoomInfo, we’re out. That said, the stock currently trades at 3× forward price-to-sales (or $11.12 per share). While this valuation is reasonable, we don’t see a big opportunity at the moment. There are more exciting stocks to buy at the moment. Let us point you toward one of our top software and edge computing picks.
High-Quality Stocks for All Market Conditions
Donald Trump’s April 2025 "Liberation Day" tariffs sent markets into a tailspin, but stocks have since rebounded strongly, proving that knee-jerk reactions often create the best buying opportunities.
The smart money is already positioning for the next leg up. Don’t miss out on the recovery - check out our Top 6 Stocks for this week. This is a curated list of our High Quality stocks that have generated a market-beating return of 183% over the last five years (as of March 31st 2025).
Stocks that made our list in 2020 include now familiar names such as Nvidia (+1,545% between March 2020 and March 2025) as well as under-the-radar businesses like the once-small-cap company Exlservice (+354% five-year return). Find your next big winner with StockStory today.
StockStory is growing and hiring equity analyst and marketing roles. Are you a 0 to 1 builder passionate about the markets and AI? See the open roles here.