ETFOptimize | High-performance ETF-based Investment Strategies

Quantitative strategies, Wall Street-caliber research, and insightful market analysis since 1998.


ETFOptimize | HOME
Close Window

Aflac (AFL): Buy, Sell, or Hold Post Q2 Earnings?

AFL Cover Image

Aflac currently trades at $107.18 per share and has shown little upside over the past six months, posting a small loss of 1.2%. The stock also fell short of the S&P 500’s 22.9% gain during that period.

Is there a buying opportunity in Aflac, or does it present a risk to your portfolio? Get the full stock story straight from our expert analysts, it’s free for active Edge members.

Why Do We Think Aflac Will Underperform?

We're sitting this one out for now. Here are three reasons why AFL doesn't excite us and a stock we'd rather own.

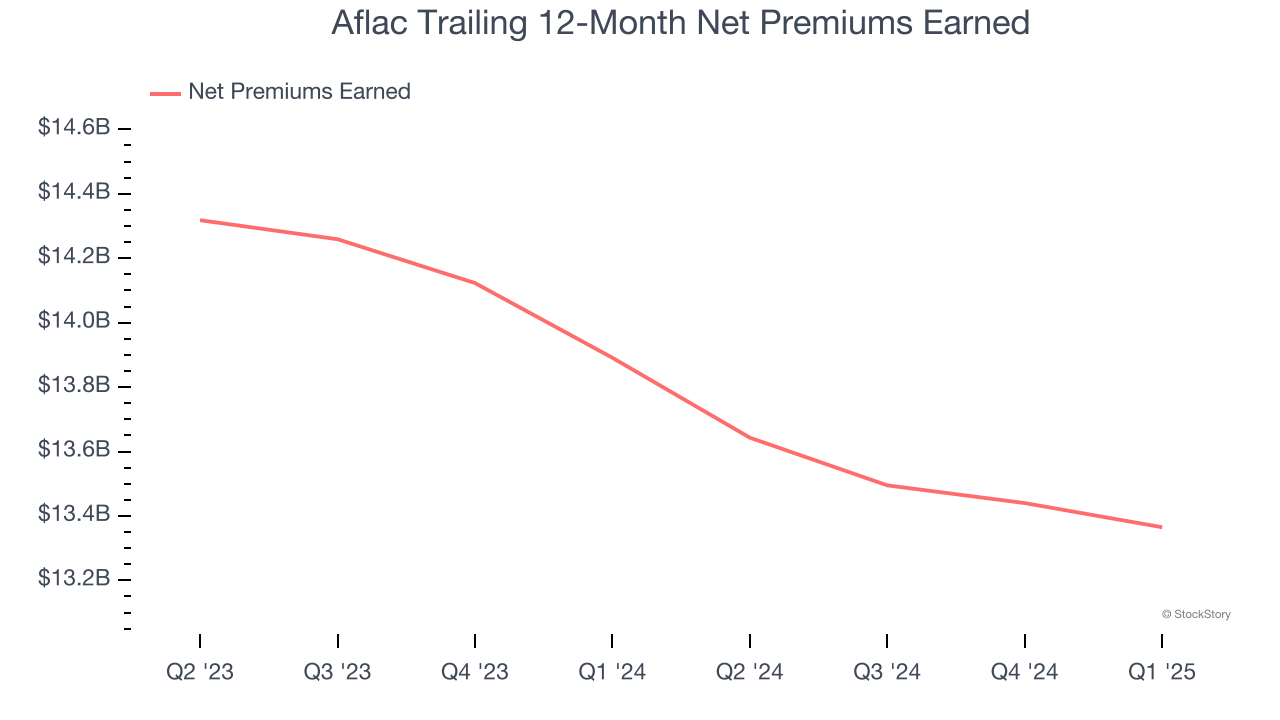
1. Declining Net Premiums Earned Reflect Weakness

Insurers sell policies then use reinsurance (insurance for insurance companies) to protect themselves from large losses. Net premiums earned are therefore what's collected from selling policies less what’s paid to reinsurers as a risk mitigation tool.

Aflac’s net premiums earned has declined by 7.8% annually over the last four years, much worse than the broader insurance industry.

Aflac Trailing 12-Month Net Premiums Earned

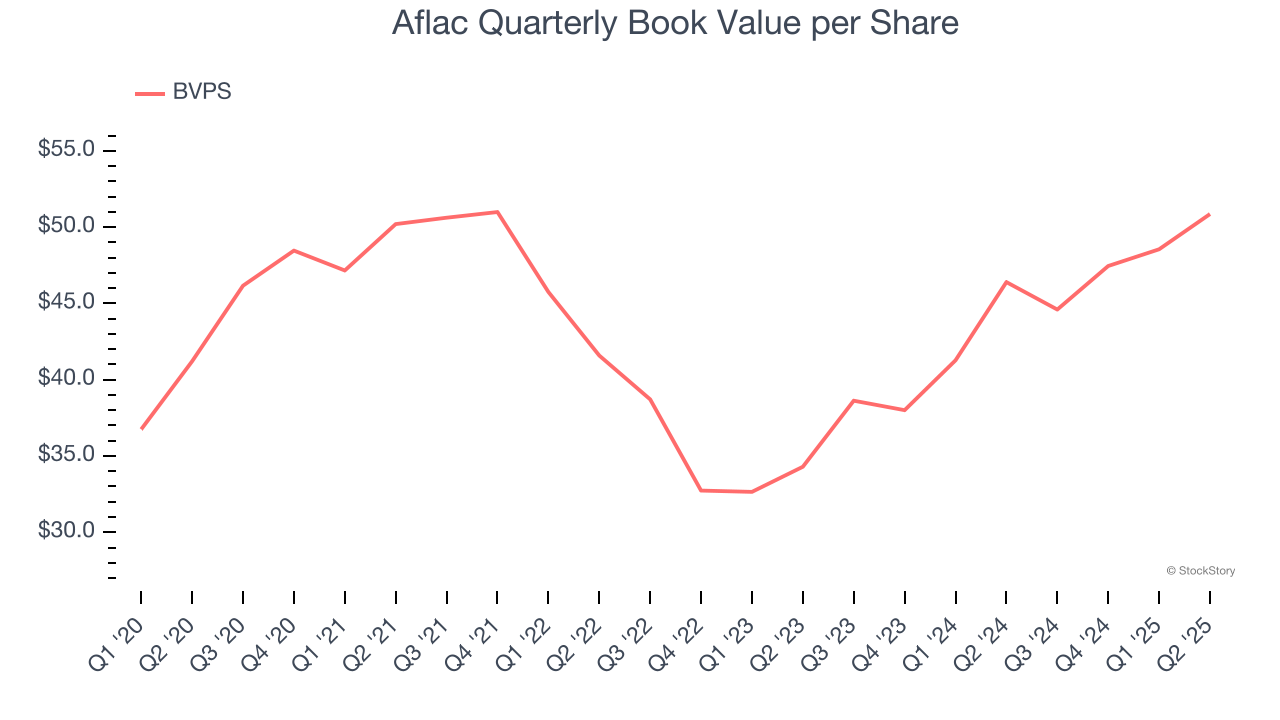
3. Projected BVPS Growth Is Slim

An insurer’s book value per share (BVPS) increases when it maintains a profitable pre-tax profit margin and effectively manages its investment portfolio.

Over the next 12 months, Consensus estimates call for Aflac’s BVPS to grow by 4.6% to $52.33, lousy growth rate.

Aflac Quarterly Book Value per Share

Final Judgment

Aflac doesn’t pass our quality test. With its shares lagging the market recently, the stock trades at 2.1× forward P/B (or $107.18 per share). At this valuation, there’s a lot of good news priced in - we think there are better stocks to buy right now. We’d suggest looking at the most dominant software business in the world.

Stocks We Would Buy Instead of Aflac

Donald Trump’s April 2025 "Liberation Day" tariffs sent markets into a tailspin, but stocks have since rebounded strongly, proving that knee-jerk reactions often create the best buying opportunities.

The smart money is already positioning for the next leg up. Don’t miss out on the recovery - check out our Top 5 Strong Momentum Stocks for this week. This is a curated list of our High Quality stocks that have generated a market-beating return of 183% over the last five years (as of March 31st 2025).

Stocks that made our list in 2020 include now familiar names such as Nvidia (+1,545% between March 2020 and March 2025) as well as under-the-radar businesses like the once-small-cap company Exlservice (+354% five-year return). Find your next big winner with StockStory today.

StockStory is growing and hiring equity analyst and marketing roles. Are you a 0 to 1 builder passionate about the markets and AI? See the open roles here.

Recent Quotes

View More
Symbol Price Change (%)
AMZN  224.21
+0.00 (0.00%)
AAPL  262.82
+0.00 (0.00%)
AMD  252.92
+0.00 (0.00%)
BAC  52.57
+0.00 (0.00%)
GOOG  260.51
+0.00 (0.00%)
META  738.36
+0.00 (0.00%)
MSFT  523.61
+0.00 (0.00%)
NVDA  186.26
+0.00 (0.00%)
ORCL  283.33
+0.00 (0.00%)
TSLA  433.72
+0.00 (0.00%)
Stock Quote API & Stock News API supplied by www.cloudquote.io
Quotes delayed at least 20 minutes.
By accessing this page, you agree to the Privacy Policy and Terms Of Service.


IntelligentValue Home
Close Window

DISCLAIMER

All content herein is issued solely for informational purposes and is not to be construed as an offer to sell or the solicitation of an offer to buy, nor should it be interpreted as a recommendation to buy, hold or sell (short or otherwise) any security.  All opinions, analyses, and information included herein are based on sources believed to be reliable, but no representation or warranty of any kind, expressed or implied, is made including but not limited to any representation or warranty concerning accuracy, completeness, correctness, timeliness or appropriateness. We undertake no obligation to update such opinions, analysis or information. You should independently verify all information contained on this website. Some information is based on analysis of past performance or hypothetical performance results, which have inherent limitations. We make no representation that any particular equity or strategy will or is likely to achieve profits or losses similar to those shown. Shareholders, employees, writers, contractors, and affiliates associated with ETFOptimize.com may have ownership positions in the securities that are mentioned. If you are not sure if ETFs, algorithmic investing, or a particular investment is right for you, you are urged to consult with a Registered Investment Advisor (RIA). Neither this website nor anyone associated with producing its content are Registered Investment Advisors, and no attempt is made herein to substitute for personalized, professional investment advice. Neither ETFOptimize.com, Global Alpha Investments, Inc., nor its employees, service providers, associates, or affiliates are responsible for any investment losses you may incur as a result of using the information provided herein. Remember that past investment returns may not be indicative of future returns.

Copyright © 1998-2017 ETFOptimize.com, a publication of Optimized Investments, Inc. All rights reserved.