
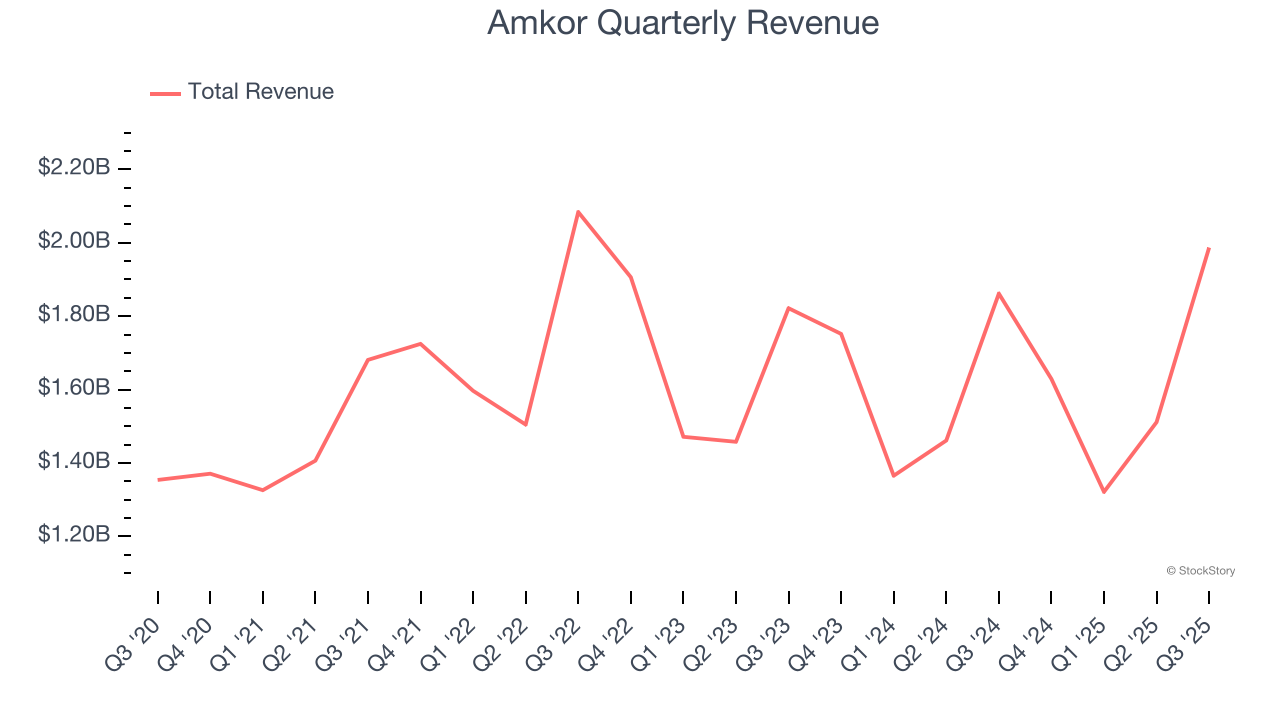
Semiconductor packaging and testing company Amkor Technology (NASDAQ: AMKR) announced better-than-expected revenue in Q3 CY2025, with sales up 6.7% year on year to $1.99 billion. On the other hand, next quarter’s revenue guidance of $1.83 billion was less impressive, coming in 1.2% below analysts’ estimates. Its GAAP profit of $0.51 per share was 20.7% above analysts’ consensus estimates.
Is now the time to buy Amkor? Find out by accessing our full research report, it’s free for active Edge members.
Amkor (AMKR) Q3 CY2025 Highlights:
- Revenue: $1.99 billion vs analyst estimates of $1.94 billion (6.7% year-on-year growth, 2.6% beat)
- EPS (GAAP): $0.51 vs analyst estimates of $0.42 (20.7% beat)
- Adjusted EBITDA: $340 million vs analyst estimates of $315.5 million (17.1% margin, 7.8% beat)
- Revenue Guidance for Q4 CY2025 is $1.83 billion at the midpoint, below analyst estimates of $1.85 billion
- EPS (GAAP) guidance for Q4 CY2025 is $0.43 at the midpoint, beating analyst estimates by 3.8%
- Operating Margin: 8%, in line with the same quarter last year
- Free Cash Flow was -$77.93 million compared to -$31.33 million in the same quarter last year
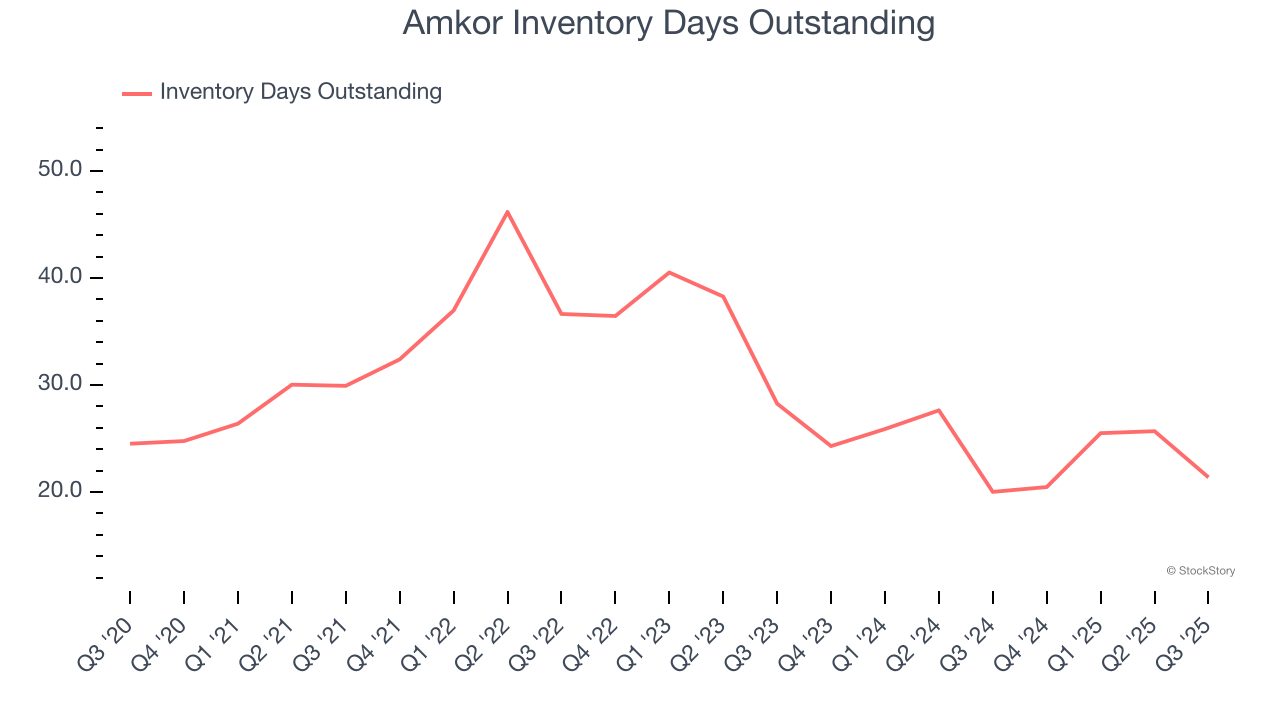
- Inventory Days Outstanding: 21, down from 26 in the previous quarter
- Market Capitalization: $8.10 billion
“Amkor delivered third quarter revenue of $1.99 billion, a 31% sequential increase, fueled by demand for Advanced packaging, which set a new revenue record,” said Giel Rutten, Amkor’s president and chief executive officer.
Company Overview
Operating through a largely Asian facility footprint, Amkor Technologies (NASDAQ: AMKR) provides outsourced packaging and testing for semiconductors.
Revenue Growth
A company’s top-line performance can indicate its business quality. Rapid growth can signal it’s benefiting from an innovative new product or burgeoning market trend. Amkor’s demand was weak over the last two years as its sales fell by 1.6% annually, a tough starting point for our analysis. Semiconductors are a cyclical industry, and long-term investors should be prepared for periods of high growth followed by periods of revenue contractions.
We at StockStory place the most emphasis on long-term growth, but within semiconductors, a half-decade historical view may miss new demand cycles or industry trends like AI. Amkor’s performance shows it grew in the past but relinquished its gains over the last two years, as its revenue fell by 1.6% annually. 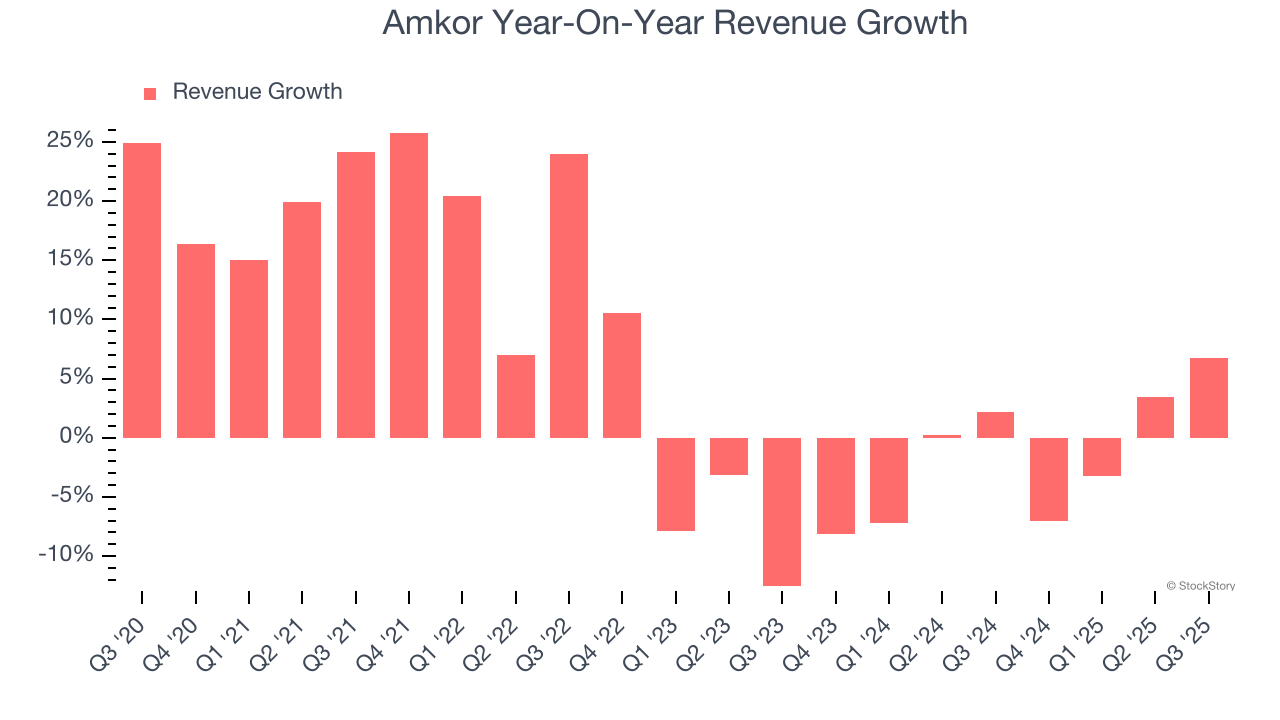
This quarter, Amkor reported year-on-year revenue growth of 6.7%, and its $1.99 billion of revenue exceeded Wall Street’s estimates by 2.6%. Company management is currently guiding for a 12% year-on-year increase in sales next quarter.
Looking further ahead, sell-side analysts expect revenue to grow 9.6% over the next 12 months. While this projection suggests its newer products and services will spur better top-line performance, it is still below the sector average.
Unless you’ve been living under a rock, it should be obvious by now that generative AI is going to have a huge impact on how large corporations do business. While Nvidia and AMD are trading close to all-time highs, we prefer a lesser-known (but still profitable) stock benefiting from the rise of AI. Click here to access our free report one of our favorites growth stories.
Product Demand & Outstanding Inventory
Days Inventory Outstanding (DIO) is an important metric for chipmakers, as it reflects a business’ capital intensity and the cyclical nature of semiconductor supply and demand. In a tight supply environment, inventories tend to be stable, allowing chipmakers to exert pricing power. Steadily increasing DIO can be a warning sign that demand is weak, and if inventories continue to rise, the company may have to downsize production.
This quarter, Amkor’s DIO came in at 21, which is 9 days below its five-year average. At the moment, these numbers show no indication of an excessive inventory buildup.
Key Takeaways from Amkor’s Q3 Results
We were impressed by Amkor’s strong improvement in inventory levels. We were also glad its EPS outperformed Wall Street’s estimates and EPS guidance beat. On the other hand, its revenue guidance for next quarter slightly missed. Overall, this print was mixed. The stock remained flat at $32.90 immediately after reporting.
Is Amkor an attractive investment opportunity right now? If you’re making that decision, you should consider the bigger picture of valuation, business qualities, as well as the latest earnings. We cover that in our actionable full research report which you can read here, it’s free for active Edge members.