
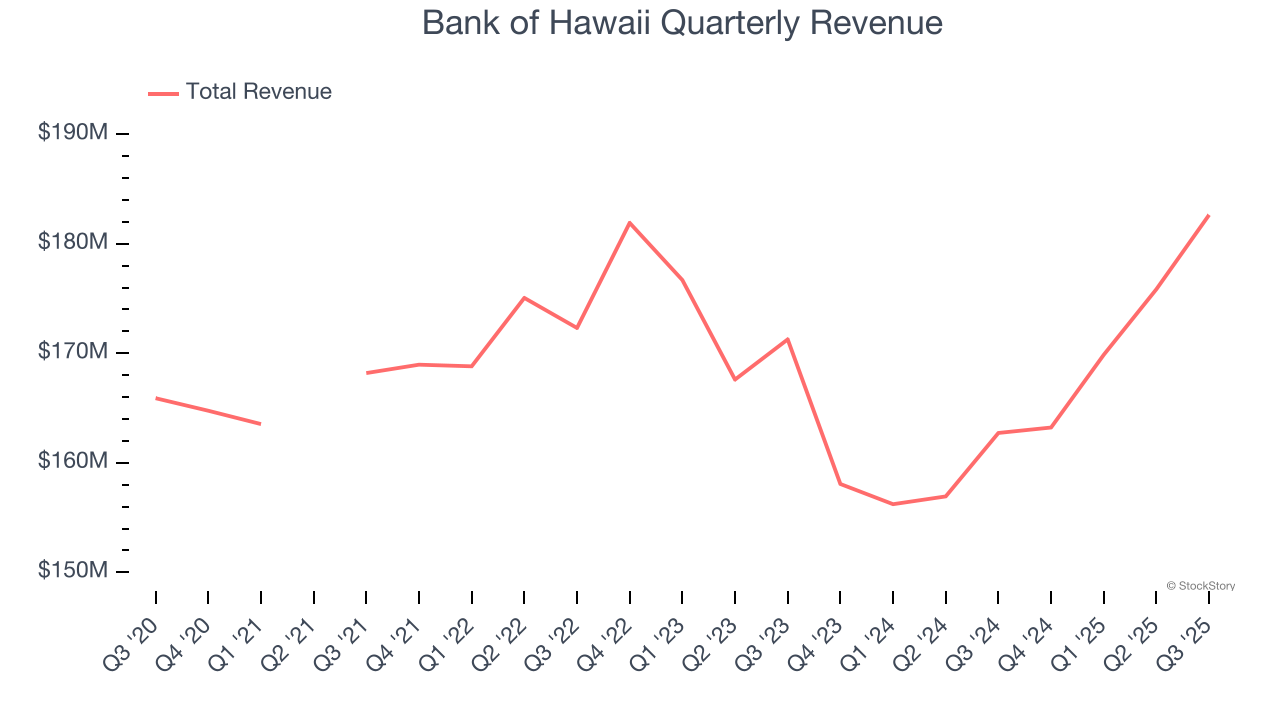
Regional banking institution Bank of Hawaii (NYSE: BOH) announced better-than-expected revenue in Q3 CY2025, with sales up 12.2% year on year to $182.6 million. Its GAAP profit of $1.20 per share was 4% above analysts’ consensus estimates.
Is now the time to buy Bank of Hawaii? Find out by accessing our full research report, it’s free for active Edge members.
Bank of Hawaii (BOH) Q3 CY2025 Highlights:
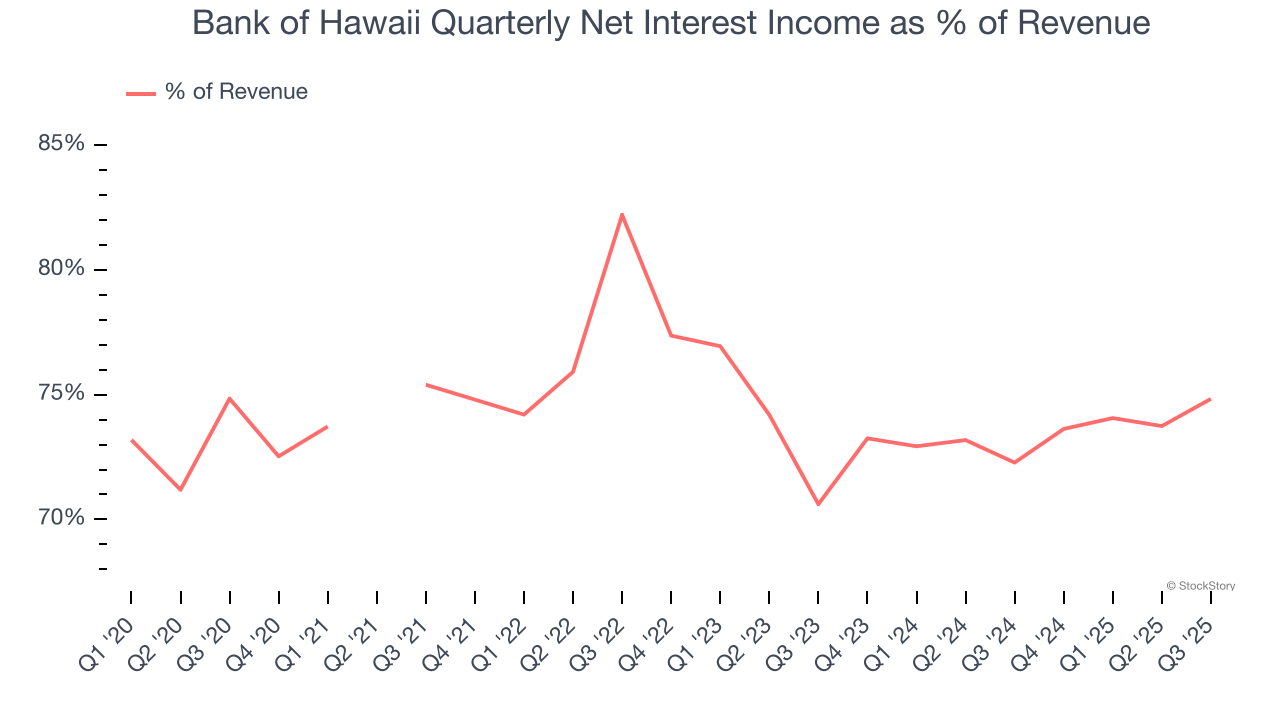
- Net Interest Income: $136.7 million vs analyst estimates of $136 million (16.2% year-on-year growth, in line)
- Net Interest Margin: 2.5% vs analyst estimates of 2.5% (in line)
- Revenue: $182.6 million vs analyst estimates of $179.5 million (12.2% year-on-year growth, 1.8% beat)
- Efficiency Ratio: 61.5% vs analyst estimates of 59.9% (159.7 basis point miss)
- EPS (GAAP): $1.20 vs analyst estimates of $1.15 (4% beat)
- Tangible Book Value per Share: $35.56 vs analyst estimates of $35.33 (9.7% year-on-year growth, 0.7% beat)
- Market Capitalization: $2.54 billion
“Bank of Hawai‘i delivered another quarter of solid results in the third quarter of 2025,” said Peter Ho, Chairman and CEO.
Company Overview
Founded in 1897 as a financial anchor for the newly annexed Hawaiian territory, Bank of Hawaii (NYSE: BOH) is a financial institution providing banking, investment, and insurance services primarily to customers in Hawaii, Guam, and other Pacific Islands.
Sales Growth
Net interest income and and fee-based revenue are the two pillars supporting bank earnings. The former captures profit from the gap between lending rates and deposit costs, while the latter encompasses charges for banking services, credit products, wealth management, and trading activities. Unfortunately, Bank of Hawaii struggled to consistently increase demand as its $691.6 million of revenue for the trailing 12 months was close to its revenue five years ago. This wasn’t a great result and is a sign of lacking business quality.
 Note: Quarters not shown were determined to be outliers, impacted by outsized investment gains/losses that are not indicative of the recurring fundamentals of the business.
We at StockStory place the most emphasis on long-term growth, but within financials, a half-decade historical view may miss recent interest rate changes, market returns, and industry trends. Just like its five-year trend, Bank of Hawaii’s revenue over the last two years was flat, suggesting it is in a slump. 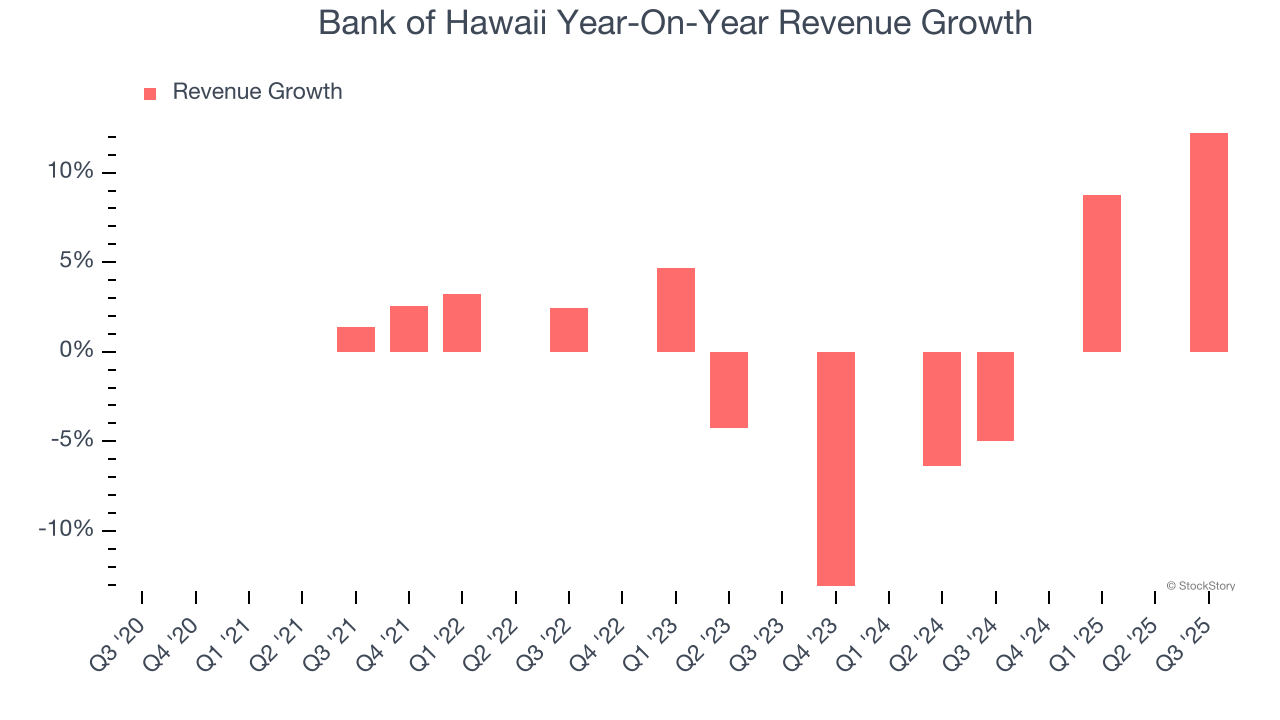 Note: Quarters not shown were determined to be outliers, impacted by outsized investment gains/losses that are not indicative of the recurring fundamentals of the business.
This quarter, Bank of Hawaii reported year-on-year revenue growth of 12.2%, and its $182.6 million of revenue exceeded Wall Street’s estimates by 1.8%.
Net interest income made up 70.8% of the company’s total revenue during the last five years, meaning lending operations are Bank of Hawaii’s largest source of revenue.
 Note: Quarters not shown were determined to be outliers, impacted by outsized investment gains/losses that are not indicative of the recurring fundamentals of the business.
While banks generate revenue from multiple sources, investors view net interest income as the cornerstone - its predictable, recurring characteristics stand in sharp contrast to the volatility of non-interest income.
Here at StockStory, we certainly understand the potential of thematic investing. Diverse winners from Microsoft (MSFT) to Alphabet (GOOG), Coca-Cola (KO) to Monster Beverage (MNST) could all have been identified as promising growth stories with a megatrend driving the growth. So, in that spirit, we’ve identified a relatively under-the-radar profitable growth stock benefiting from the rise of AI, available to you FREE via this link.
Tangible Book Value Per Share (TBVPS)
Banks operate as balance sheet businesses, with profits generated through borrowing and lending activities. Valuations reflect this reality, emphasizing balance sheet strength and long-term book value compounding ability.
This explains why tangible book value per share (TBVPS) stands as the premier banking metric. TBVPS strips away questionable intangible assets, revealing concrete per-share net worth that investors can trust. Traditional metrics like EPS are helpful but face distortion from M&A activity and loan loss accounting rules.
Bank of Hawaii’s TBVPS grew at a sluggish 1.4% annual clip over the last five years. However, TBVPS growth has accelerated recently, growing by 10.8% annually over the last two years from $28.99 to $35.56 per share.
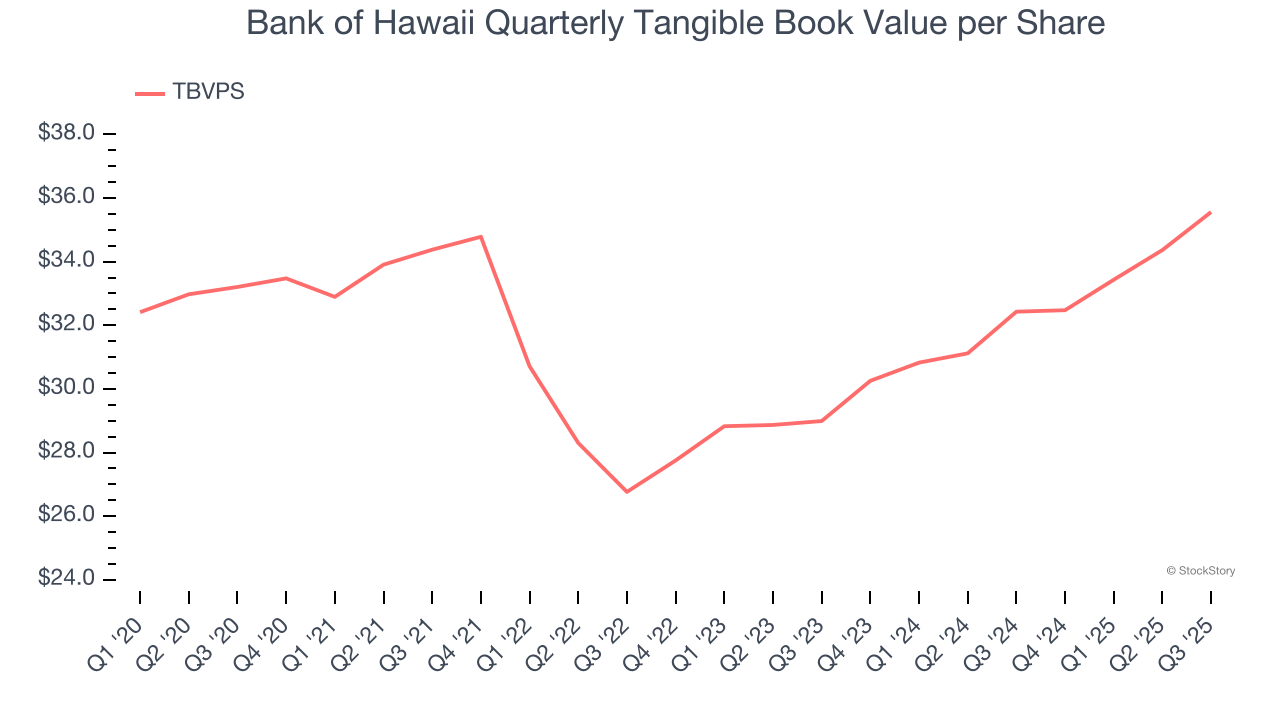
Over the next 12 months, Consensus estimates call for Bank of Hawaii’s TBVPS to grow by 7% to $38.05, mediocre growth rate.
Key Takeaways from Bank of Hawaii’s Q3 Results
It was encouraging to see Bank of Hawaii beat analysts’ revenue expectations this quarter. We were also happy its tangible book value per share narrowly outperformed Wall Street’s estimates. Overall, this print had some key positives. The stock traded up 1.7% to $65 immediately after reporting.
So should you invest in Bank of Hawaii right now? What happened in the latest quarter matters, but not as much as longer-term business quality and valuation, when deciding whether to invest in this stock. We cover that in our actionable full research report which you can read here, it’s free for active Edge members.