What a time it’s been for National Vision. In the past six months alone, the company’s stock price has increased by a massive 111%, reaching $25.95 per share. This was partly thanks to its solid quarterly results, and the run-up might have investors contemplating their next move.
Is there a buying opportunity in National Vision, or does it present a risk to your portfolio? Check out our in-depth research report to see what our analysts have to say, it’s free for active Edge members.
Why Is National Vision Not Exciting?
Despite the momentum, we're cautious about National Vision. Here are three reasons you should be careful with EYE and a stock we'd rather own.
1. Stores Are Closing, a Headwind for Revenue
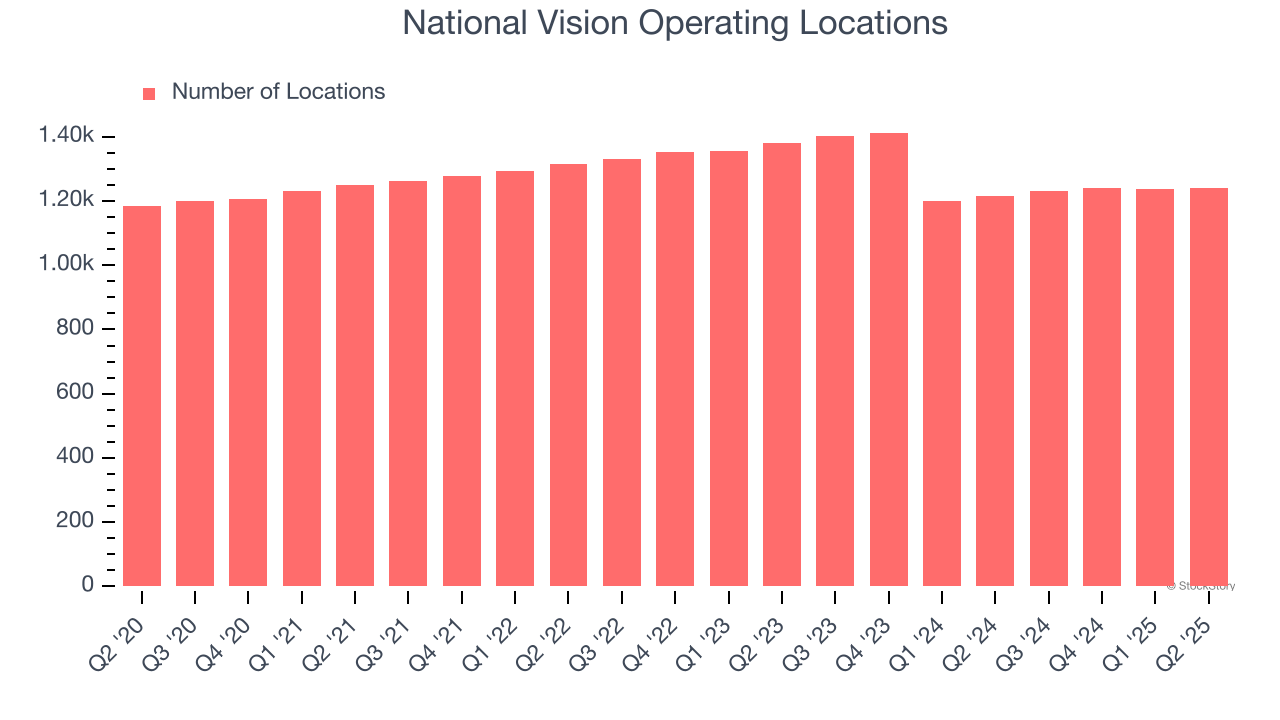
A retailer’s store count often determines how much revenue it can generate.
National Vision operated 1,240 locations in the latest quarter. Over the last two years, the company has generally closed its stores, averaging 4.2% annual declines.
When a retailer shutters stores, it usually means that brick-and-mortar demand is less than supply, and it is responding by closing underperforming locations to improve profitability.
2. Breakeven Operating Margin Raises Questions
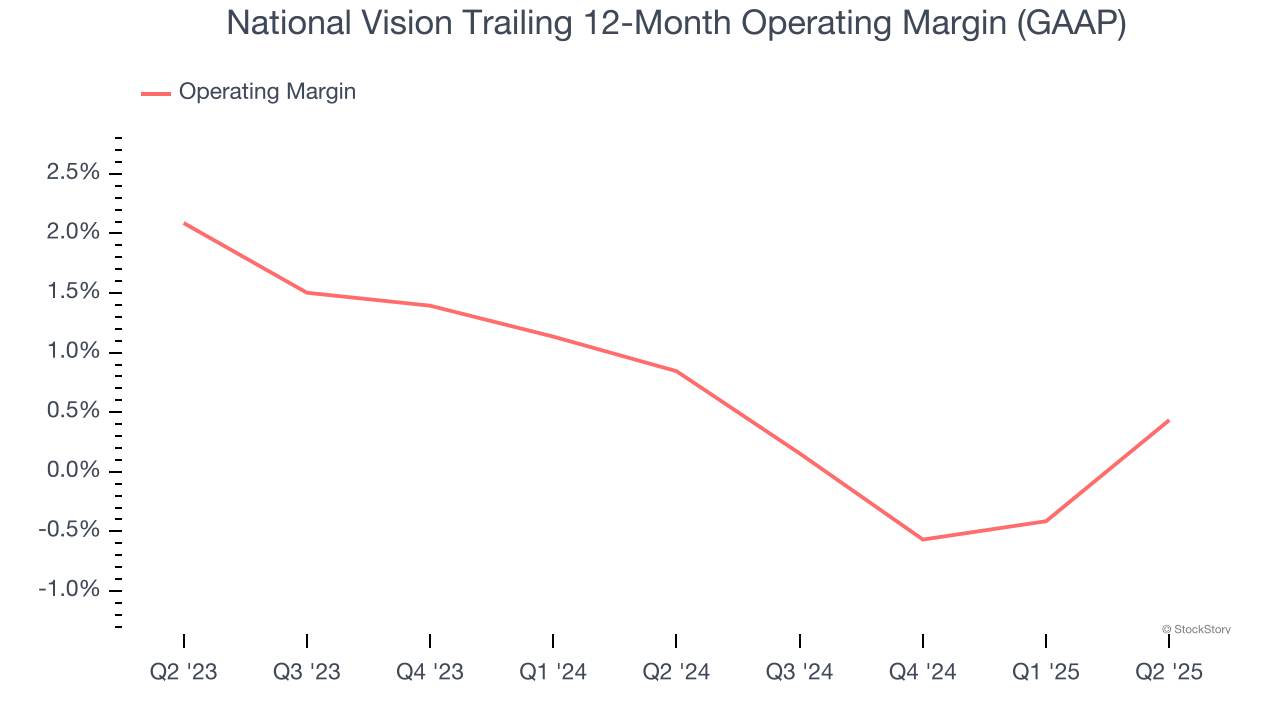
Operating margin is an important measure of profitability as it shows the portion of revenue left after accounting for all core expenses – everything from the cost of goods sold to advertising and wages. It’s also useful for comparing profitability across companies with different levels of debt and tax rates because it excludes interest and taxes.
National Vision’s operating margin might fluctuated slightly over the last 12 months but has remained more or less the same. The company broke even over the last two years, inadequate for a consumer retail business. Its large expense base and inefficient cost structure were the main culprits behind this performance.
3. Previous Growth Initiatives Haven’t Impressed
Growth gives us insight into a company’s long-term potential, but how capital-efficient was that growth? Enter ROIC, a metric showing how much operating profit a company generates relative to the money it has raised (debt and equity).
National Vision historically did a mediocre job investing in profitable growth initiatives. Its five-year average ROIC was 3.6%, lower than the typical cost of capital (how much it costs to raise money) for consumer retail companies.
Final Judgment
National Vision isn’t a terrible business, but it doesn’t pass our quality test. After the recent rally, the stock trades at 32.9× forward P/E (or $25.95 per share). Investors with a higher risk tolerance might like the company, but we don’t really see a big opportunity at the moment. We're pretty confident there are more exciting stocks to buy at the moment. Let us point you toward one of our top digital advertising picks.
High-Quality Stocks for All Market Conditions
Trump’s April 2025 tariff bombshell triggered a massive market selloff, but stocks have since staged an impressive recovery, leaving those who panic sold on the sidelines.
Take advantage of the rebound by checking out our Top 5 Growth Stocks for this month. This is a curated list of our High Quality stocks that have generated a market-beating return of 183% over the last five years (as of March 31st 2025).
Stocks that made our list in 2020 include now familiar names such as Nvidia (+1,545% between March 2020 and March 2025) as well as under-the-radar businesses like the once-micro-cap company Kadant (+351% five-year return). Find your next big winner with StockStory today.
StockStory is growing and hiring equity analyst and marketing roles. Are you a 0 to 1 builder passionate about the markets and AI? See the open roles here.