
Arhaus trades at $10.19 and has moved in lockstep with the market. Its shares have returned 23.1% over the last six months while the S&P 500 has gained 24.4%.
Is there a buying opportunity in Arhaus, or does it present a risk to your portfolio? See what our analysts have to say in our full research report, it’s free for active Edge members.
Why Is Arhaus Not Exciting?
We're cautious about Arhaus. Here are three reasons you should be careful with ARHS and a stock we'd rather own.
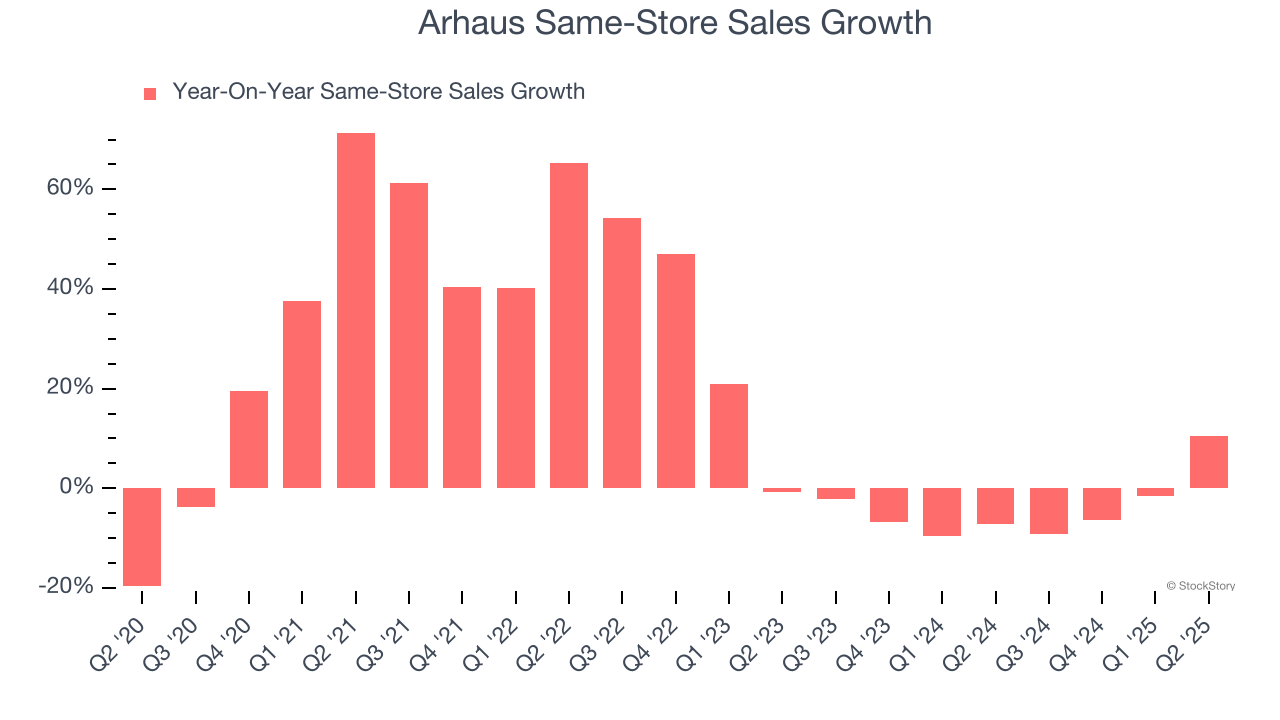
1. Shrinking Same-Store Sales Indicate Waning Demand
Same-store sales is a key performance indicator used to measure organic growth at brick-and-mortar shops for at least a year.
Arhaus’s demand has been shrinking over the last two years as its same-store sales have averaged 4% annual declines.
2. Fewer Distribution Channels Limit its Ceiling
With $1.34 billion in revenue over the past 12 months, Arhaus is a small retailer, which sometimes brings disadvantages compared to larger competitors benefiting from economies of scale and negotiating leverage with suppliers. On the bright side, it can grow faster because it has more white space to build new stores.
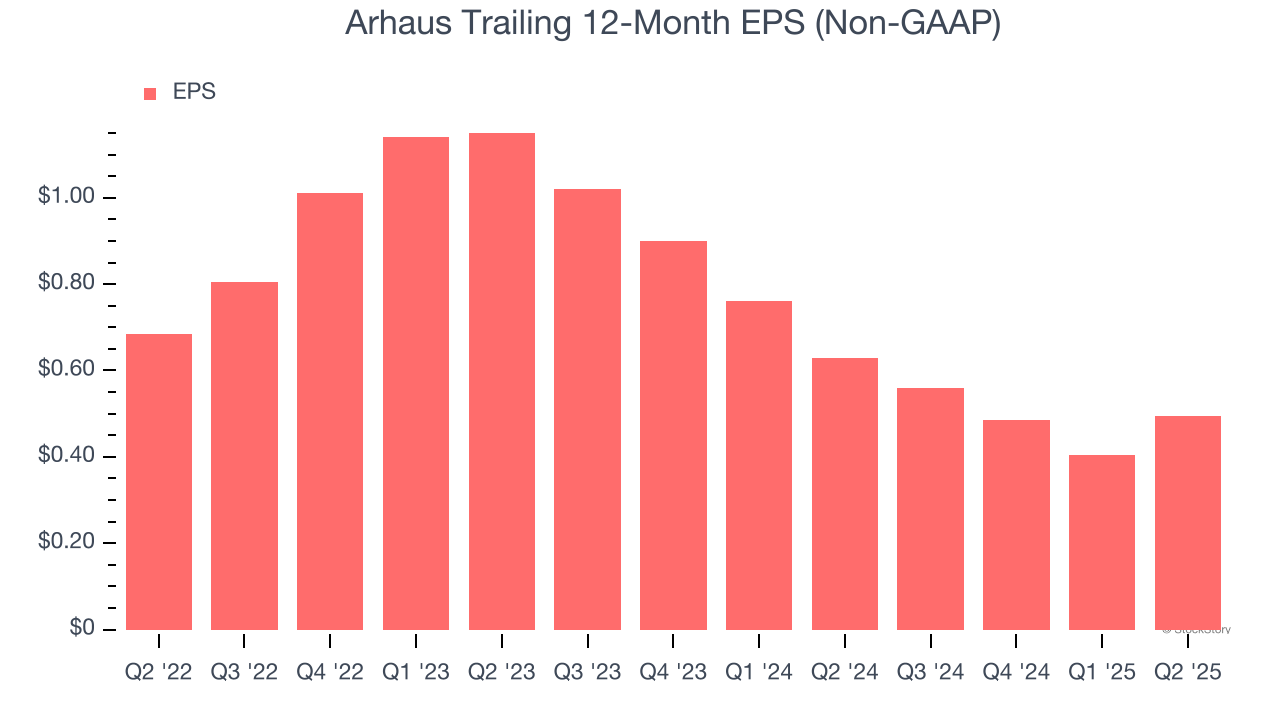
3. EPS Trending Down
We track the change in earnings per share (EPS) because it highlights whether a company’s growth is profitable.
Arhaus’s full-year EPS dropped 33.7%, or 10.2% annually, over the last three years. In a mature sector such as consumer retail, we tend to steer our readers away from companies with falling EPS because it could imply changing secular trends and preferences. If the tide turns unexpectedly, Arhaus’s low margin of safety could leave its stock price susceptible to large downswings.
Final Judgment
Arhaus isn’t a terrible business, but it doesn’t pass our bar. That said, the stock currently trades at 23.1× forward P/E (or $10.19 per share). At this valuation, there’s a lot of good news priced in - we think other companies feature superior fundamentals at the moment. We’d suggest looking at the most dominant software business in the world.
Stocks We Like More Than Arhaus
Trump’s April 2025 tariff bombshell triggered a massive market selloff, but stocks have since staged an impressive recovery, leaving those who panic sold on the sidelines.
Take advantage of the rebound by checking out our Top 5 Strong Momentum Stocks for this week. This is a curated list of our High Quality stocks that have generated a market-beating return of 183% over the last five years (as of March 31st 2025).
Stocks that made our list in 2020 include now familiar names such as Nvidia (+1,545% between March 2020 and March 2025) as well as under-the-radar businesses like the once-micro-cap company Tecnoglass (+1,754% five-year return). Find your next big winner with StockStory today.
StockStory is growing and hiring equity analyst and marketing roles. Are you a 0 to 1 builder passionate about the markets and AI? See the open roles here.


