
Even though Matthews (currently trading at $23.40 per share) has gained 13.2% over the last six months, it has lagged the S&P 500’s 24.4% return during that period. This may have investors wondering how to approach the situation.
Is there a buying opportunity in Matthews, or does it present a risk to your portfolio? Dive into our full research report to see our analyst team’s opinion, it’s free for active Edge members.
Why Do We Think Matthews Will Underperform?
We're sitting this one out for now. Here are three reasons why MATW doesn't excite us and a stock we'd rather own.
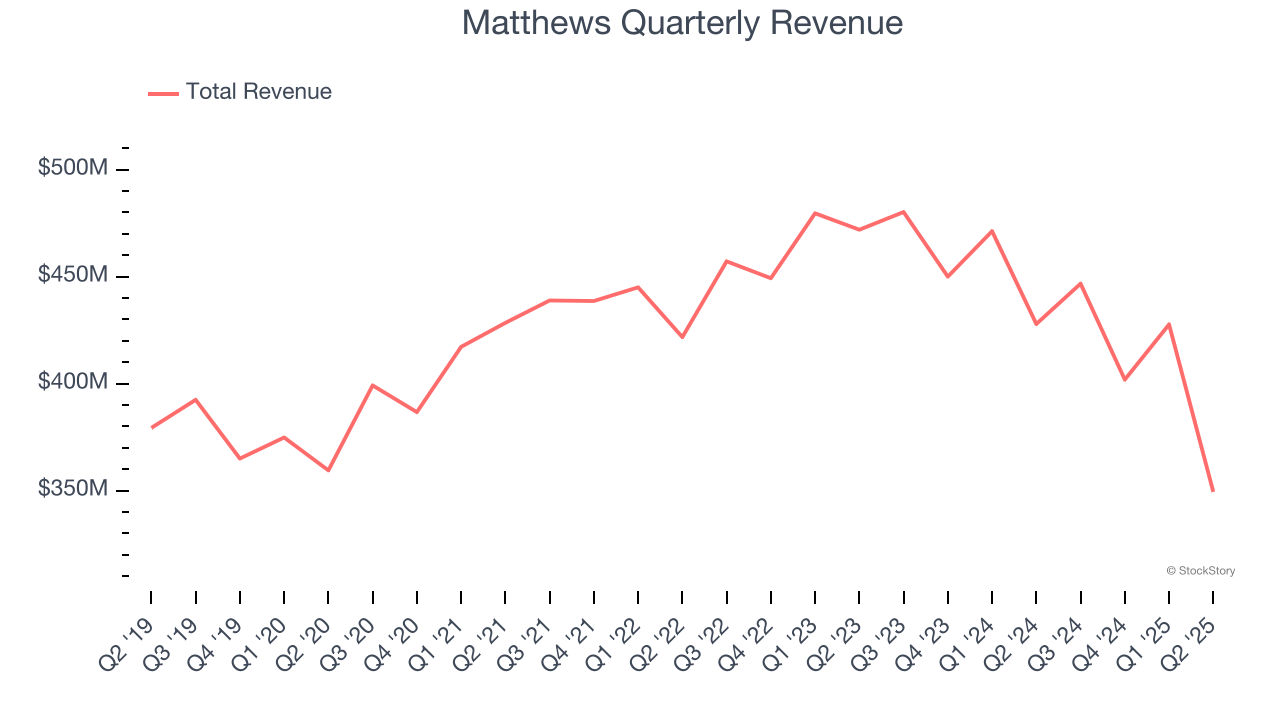
1. Long-Term Revenue Growth Disappoints
A company’s long-term sales performance can indicate its overall quality. Any business can put up a good quarter or two, but many enduring ones grow for years. Over the last five years, Matthews grew its sales at a weak 1.7% compounded annual growth rate. This fell short of our benchmarks.
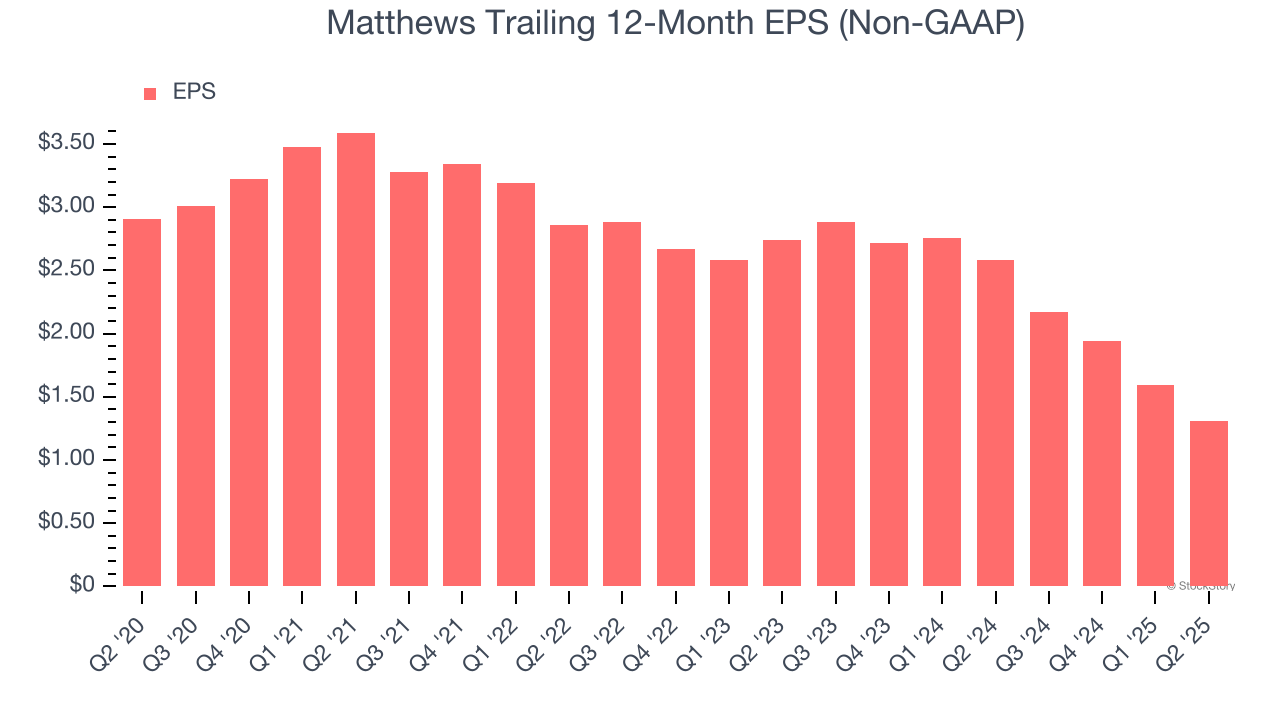
2. EPS Trending Down
We track the long-term change in earnings per share (EPS) because it highlights whether a company’s growth is profitable.
Sadly for Matthews, its EPS declined by 14.8% annually over the last five years while its revenue grew by 1.7%. This tells us the company became less profitable on a per-share basis as it expanded.
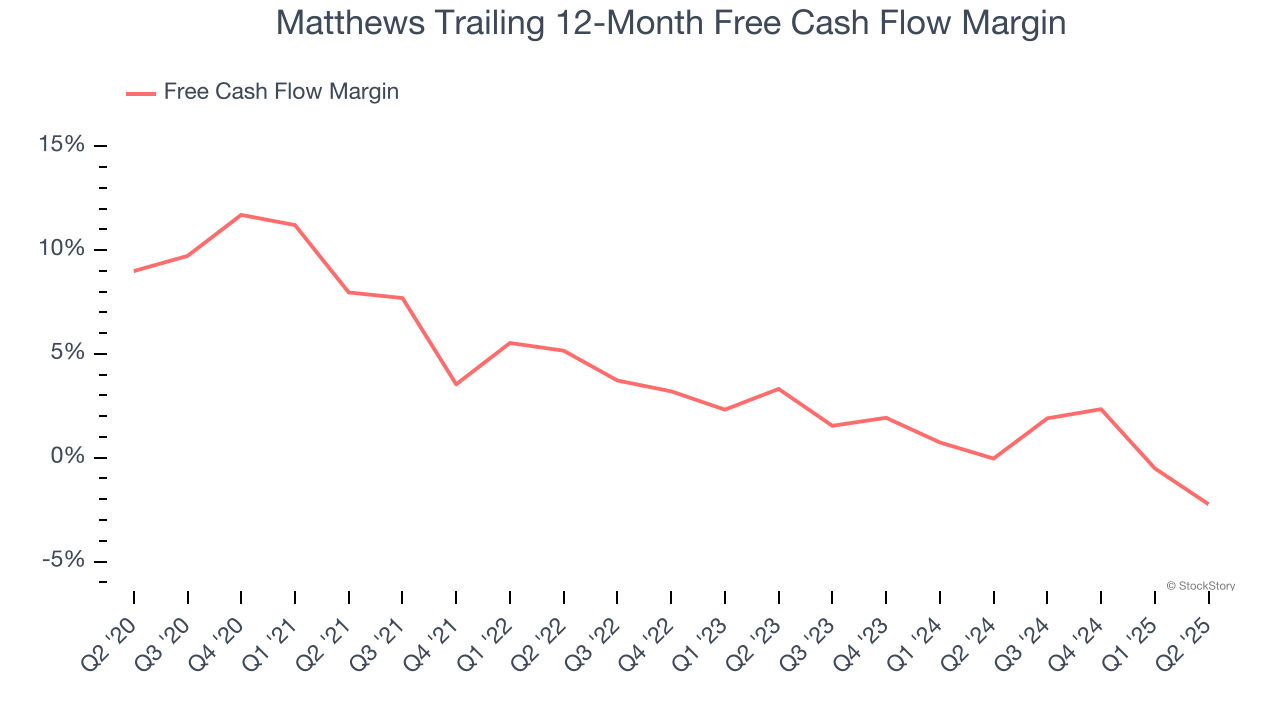
3. Cash Burn Ignites Concerns
If you’ve followed StockStory for a while, you know we emphasize free cash flow. Why, you ask? We believe that in the end, cash is king, and you can’t use accounting profits to pay the bills.
Over the last two years, Matthews’s demanding reinvestments to stay relevant have drained its resources, putting it in a pinch and limiting its ability to return capital to investors. Its free cash flow margin averaged negative 1.1%, meaning it lit $1.07 of cash on fire for every $100 in revenue.
Final Judgment
Matthews doesn’t pass our quality test. With its shares underperforming the market lately, the stock trades at 17.4× forward EV-to-EBITDA (or $23.40 per share). This valuation tells us a lot of optimism is priced in - you can find more timely opportunities elsewhere. We’d recommend looking at one of our top software and edge computing picks.
Stocks We Would Buy Instead of Matthews
Donald Trump’s April 2025 "Liberation Day" tariffs sent markets into a tailspin, but stocks have since rebounded strongly, proving that knee-jerk reactions often create the best buying opportunities.
The smart money is already positioning for the next leg up. Don’t miss out on the recovery - check out our Top 9 Market-Beating Stocks. This is a curated list of our High Quality stocks that have generated a market-beating return of 183% over the last five years (as of March 31st 2025).
Stocks that made our list in 2020 include now familiar names such as Nvidia (+1,545% between March 2020 and March 2025) as well as under-the-radar businesses like the once-small-cap company Comfort Systems (+782% five-year return). Find your next big winner with StockStory today.
StockStory is growing and hiring equity analyst and marketing roles. Are you a 0 to 1 builder passionate about the markets and AI? See the open roles here.


