
What a fantastic six months it’s been for Synchrony Financial. Shares of the company have skyrocketed 44.3%, hitting $75.29. This was partly thanks to its solid quarterly results, and the performance may have investors wondering how to approach the situation.
Following the strength, is SYF a buy right now? Or is the market overestimating its value? Find out in our full research report, it’s free for active Edge members.
Why Is Synchrony Financial a Good Business?
Powering over 73 million active accounts and partnerships with major brands like Amazon, PayPal, and Lowe's, Synchrony Financial (NYSE: SYF) provides credit cards, installment loans, and banking products through partnerships with retailers, healthcare providers, and digital platforms.
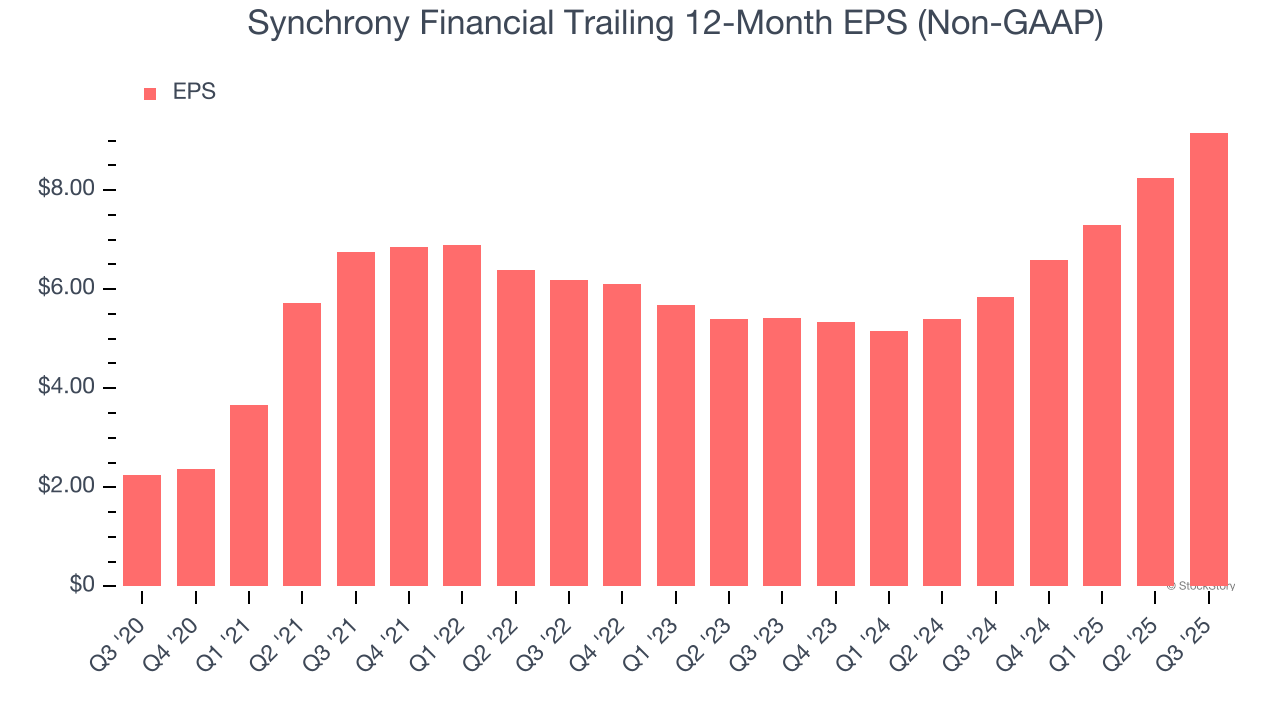
1. Outstanding Long-Term EPS Growth
We track the long-term change in earnings per share (EPS) because it highlights whether a company’s growth is profitable.
Synchrony Financial’s EPS grew at an astounding 32.5% compounded annual growth rate over the last five years, higher than its 5.3% annualized revenue growth. This tells us the company became more profitable on a per-share basis as it expanded.
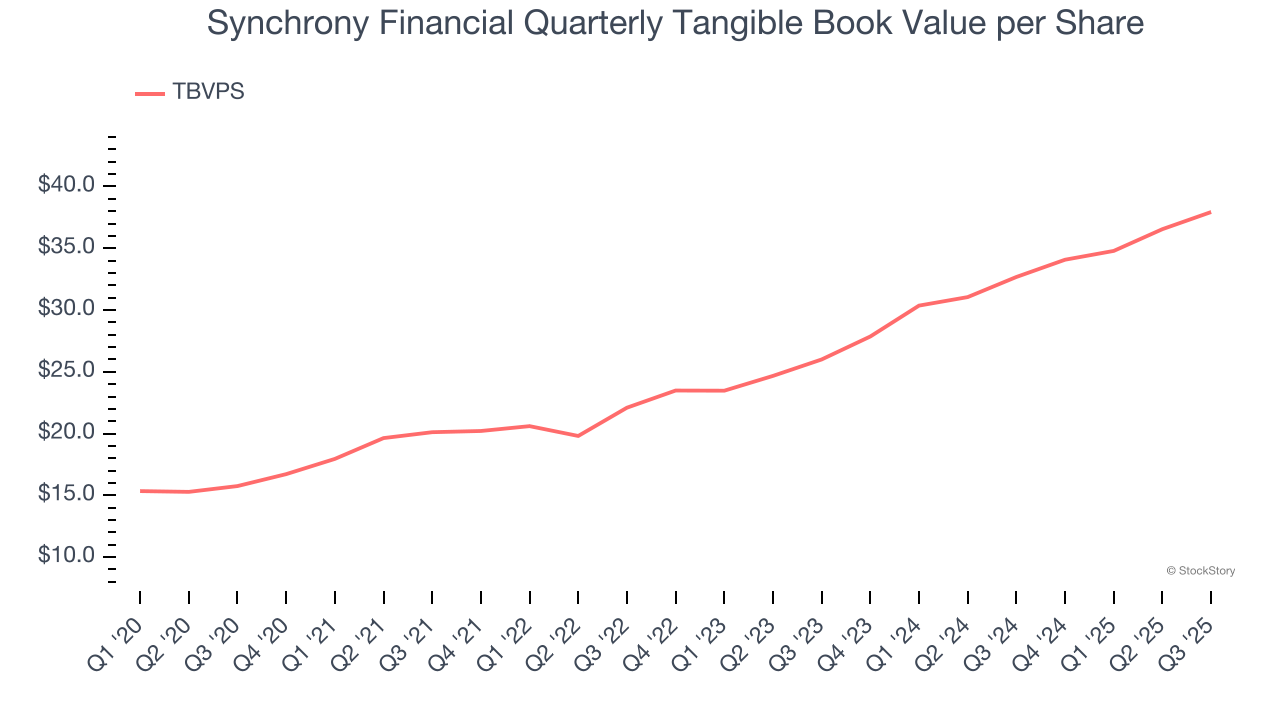
2. Growing TBVPS Reflects Strong Asset Base
Tangible book value per share (TBVPS) serves as a key indicator of a financial institution’s strength, representing the hard assets available to shareholders after removing intangible assets that could evaporate during economic distress.
Synchrony Financial’s TBVPS increased by 19.2% annually over the last five years, and growth has recently accelerated as TBVPS grew at an incredible 20.8% annual clip over the past two years (from $26.00 to $37.93 per share).
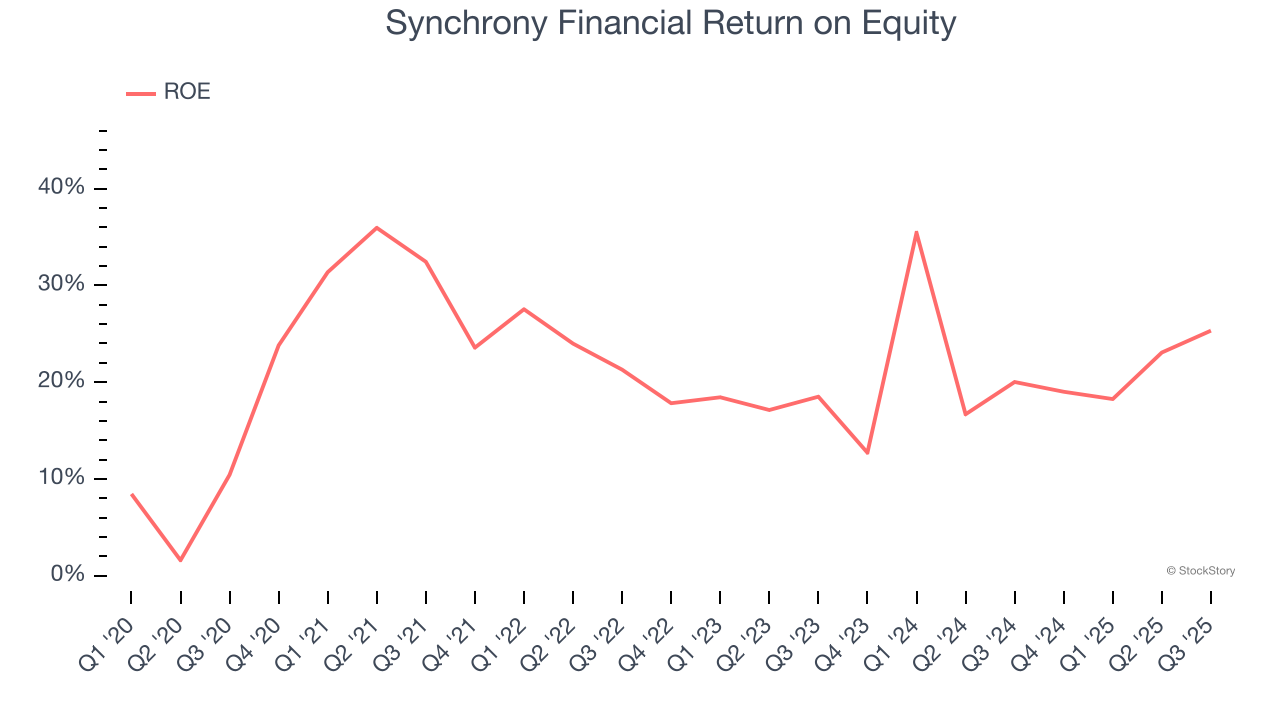
3. Stellar ROE Showcases Lucrative Growth Opportunities
Return on equity, or ROE, tells us how much profit a company generates for each dollar of shareholder equity, a key funding source for banks. Over a long period, banks with high ROE tend to compound shareholder wealth faster through retained earnings, buybacks, and dividends.
Over the last five years, Synchrony Financial has averaged an ROE of 23.1%, exceptional for a company operating in a sector where the average shakes out around 10% and those putting up 25%+ are greatly admired. This shows Synchrony Financial has a strong competitive moat.
Final Judgment
These are just a few reasons why Synchrony Financial is a cream-of-the-crop financials company, and after the recent rally, the stock trades at 8.2× forward P/E (or $75.29 per share). Is now the time to buy despite the apparent froth? See for yourself in our full research report, it’s free for active Edge members.
Stocks We Like Even More Than Synchrony Financial
Donald Trump’s April 2025 "Liberation Day" tariffs sent markets into a tailspin, but stocks have since rebounded strongly, proving that knee-jerk reactions often create the best buying opportunities.
The smart money is already positioning for the next leg up. Don’t miss out on the recovery - check out our Top 5 Growth Stocks for this month. This is a curated list of our High Quality stocks that have generated a market-beating return of 183% over the last five years (as of March 31st 2025).
Stocks that made our list in 2020 include now familiar names such as Nvidia (+1,545% between March 2020 and March 2025) as well as under-the-radar businesses like the once-micro-cap company Tecnoglass (+1,754% five-year return). Find your next big winner with StockStory today.
StockStory is growing and hiring equity analyst and marketing roles. Are you a 0 to 1 builder passionate about the markets and AI? See the open roles here.


