
Hotel and casino entertainment company Caesars Entertainment (NASDAQ: CZR) fell short of the market’s revenue expectations in Q3 CY2025, with sales flat year on year at $2.87 billion. Its GAAP loss of $0.27 per share was significantly below analysts’ consensus estimates.
Is now the time to buy Caesars Entertainment? Find out by accessing our full research report, it’s free for active Edge members.
Caesars Entertainment (CZR) Q3 CY2025 Highlights:
- Revenue: $2.87 billion vs analyst estimates of $2.89 billion (flat year on year, 0.9% miss)
- EPS (GAAP): -$0.27 vs analyst estimates of -$0.09 (significant miss)
- Adjusted EBITDA: $884 million vs analyst estimates of $945.4 million (30.8% margin, 6.5% miss)
- Operating Margin: 17.9%, down from 22.4% in the same quarter last year
- Market Capitalization: $4.69 billion
Company Overview
Formerly Eldorado Resorts, Caesars Entertainment (NASDAQ: CZR) is a global gaming and hospitality company operating numerous casinos, hotels, and resort properties.
Revenue Growth
A company’s long-term sales performance is one signal of its overall quality. Any business can experience short-term success, but top-performing ones enjoy sustained growth for years. Luckily, Caesars Entertainment’s sales grew at an incredible 34% compounded annual growth rate over the last five years. Its growth beat the average consumer discretionary company and shows its offerings resonate with customers.
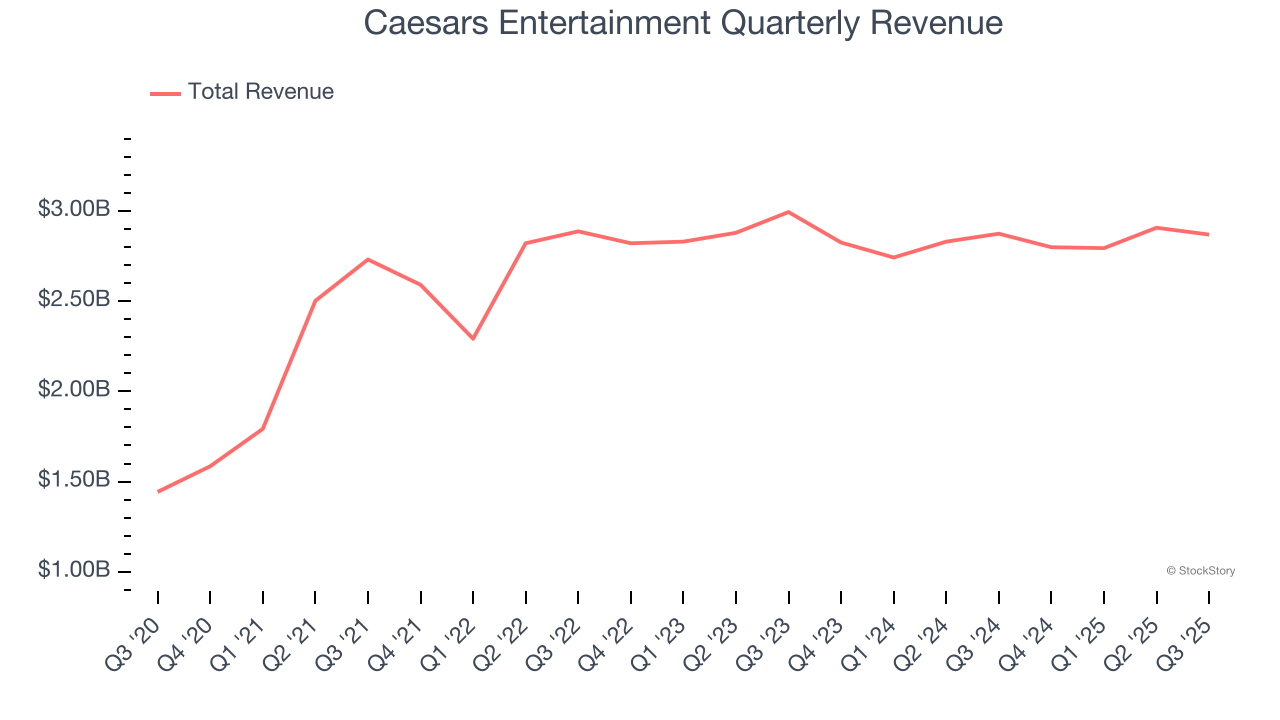
Long-term growth is the most important, but within consumer discretionary, product cycles are short and revenue can be hit-driven due to rapidly changing trends and consumer preferences. Caesars Entertainment’s recent performance shows its demand has slowed significantly as its revenue was flat over the last two years. Note that COVID hurt Caesars Entertainment’s business in 2020 and part of 2021, and it bounced back in a big way thereafter. 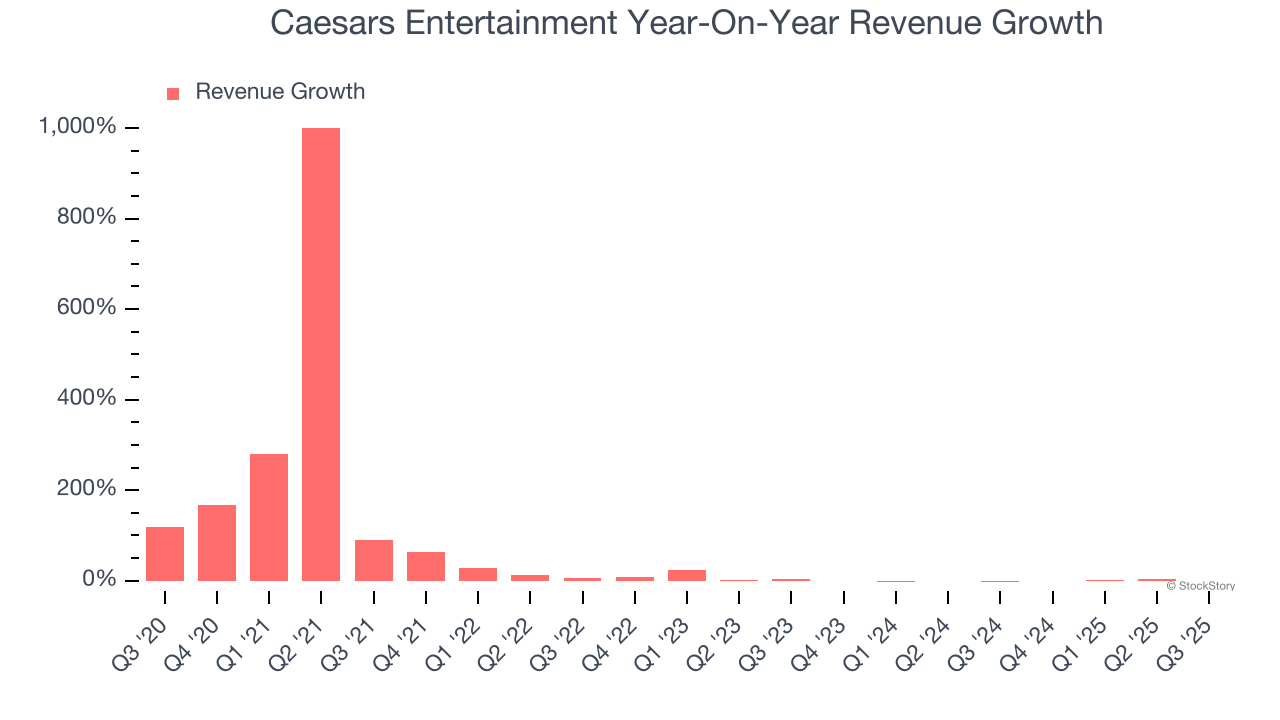
We can better understand the company’s revenue dynamics by analyzing its three most important segments: Casino, Hotel, and Dining, which are 57.2%, 15.2%, and 16.9% of revenue. Over the last two years, Caesars Entertainment’s Casino (Poker, Blackjack) and Dining (food and beverage) revenues averaged year-on-year growth of 20.2% and 14%. On the other hand, its Hotel revenue (overnight bookings) averaged 34.9% declines. 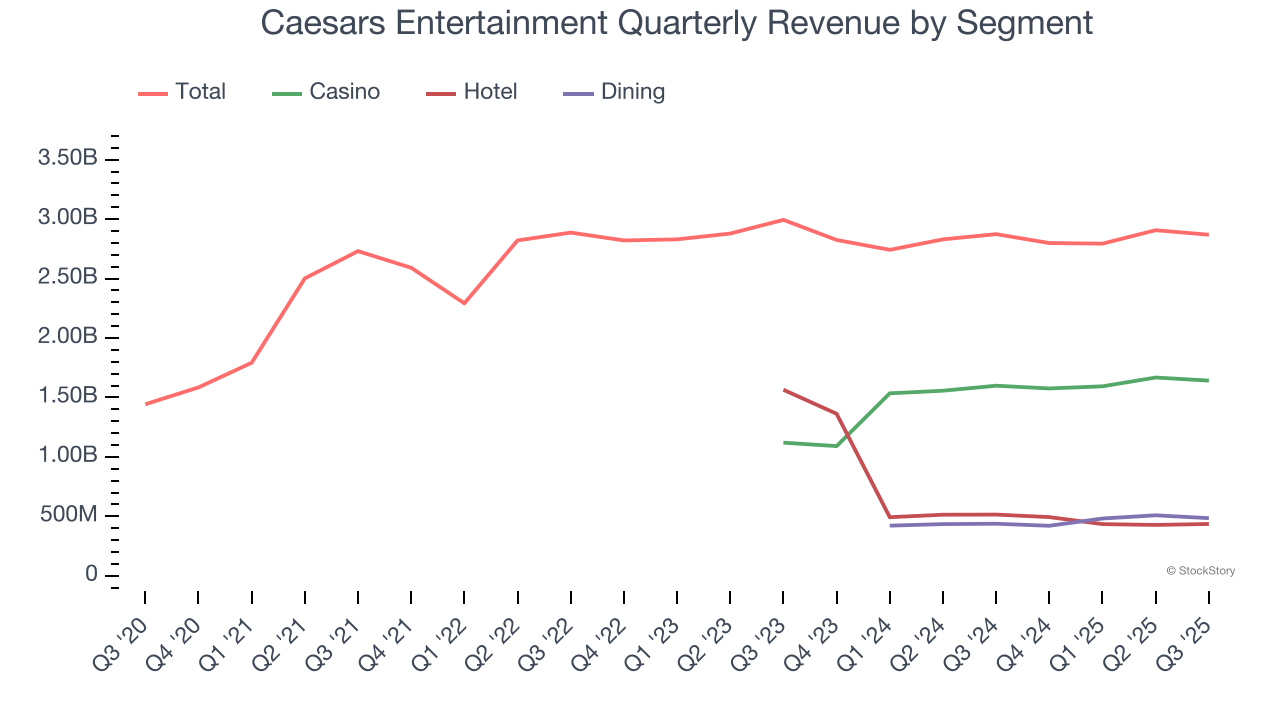
This quarter, Caesars Entertainment missed Wall Street’s estimates and reported a rather uninspiring 0.2% year-on-year revenue decline, generating $2.87 billion of revenue.
Looking ahead, sell-side analysts expect revenue to grow 3.4% over the next 12 months. Although this projection indicates its newer products and services will fuel better top-line performance, it is still below the sector average.
Software is eating the world and there is virtually no industry left that has been untouched by it. That drives increasing demand for tools helping software developers do their jobs, whether it be monitoring critical cloud infrastructure, integrating audio and video functionality, or ensuring smooth content streaming. Click here to access a free report on our 3 favorite stocks to play this generational megatrend.
Operating Margin
Caesars Entertainment’s operating margin might fluctuated slightly over the last 12 months but has remained more or less the same, averaging 19.3% over the last two years. This profitability was top-notch for a consumer discretionary business, showing it’s an well-run company with an efficient cost structure.
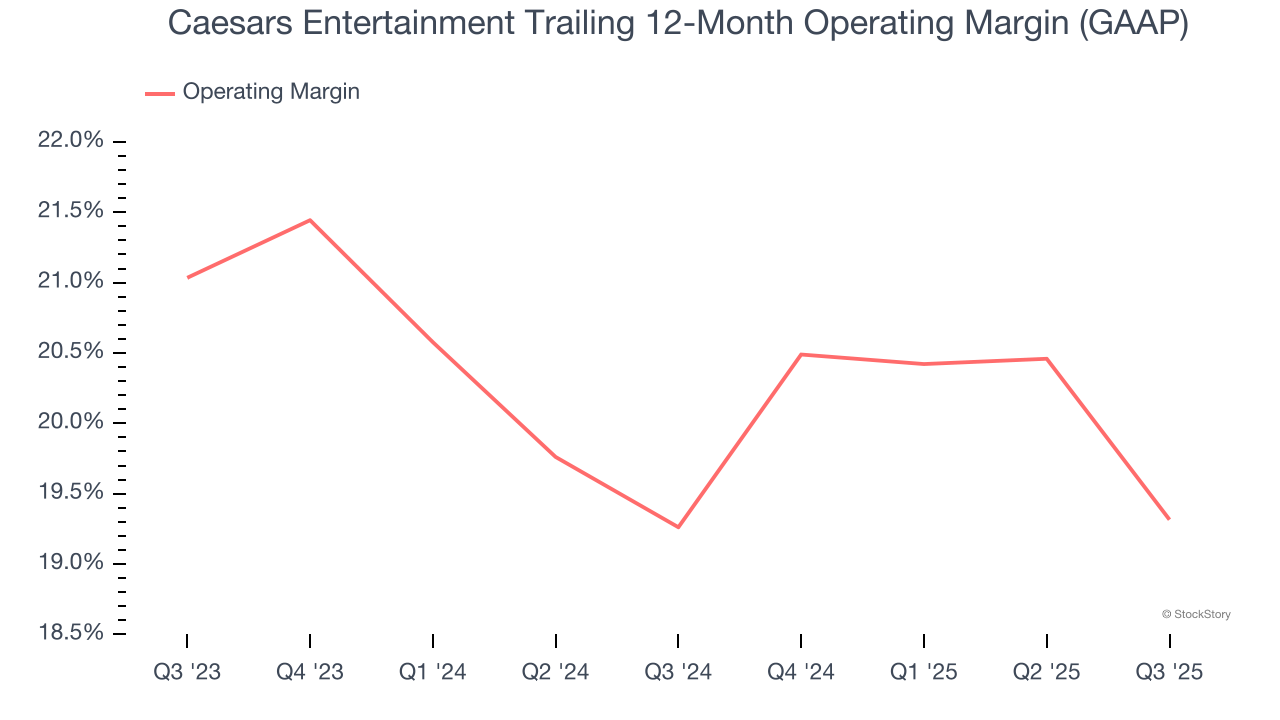
This quarter, Caesars Entertainment generated an operating margin profit margin of 17.9%, down 4.5 percentage points year on year. This contraction shows it was less efficient because its expenses increased relative to its revenue.
Earnings Per Share
Revenue trends explain a company’s historical growth, but the long-term change in earnings per share (EPS) points to the profitability of that growth – for example, a company could inflate its sales through excessive spending on advertising and promotions.
Although Caesars Entertainment’s full-year earnings are still negative, it reduced its losses and improved its EPS by 34.8% annually over the last five years. The next few quarters will be critical for assessing its long-term profitability.
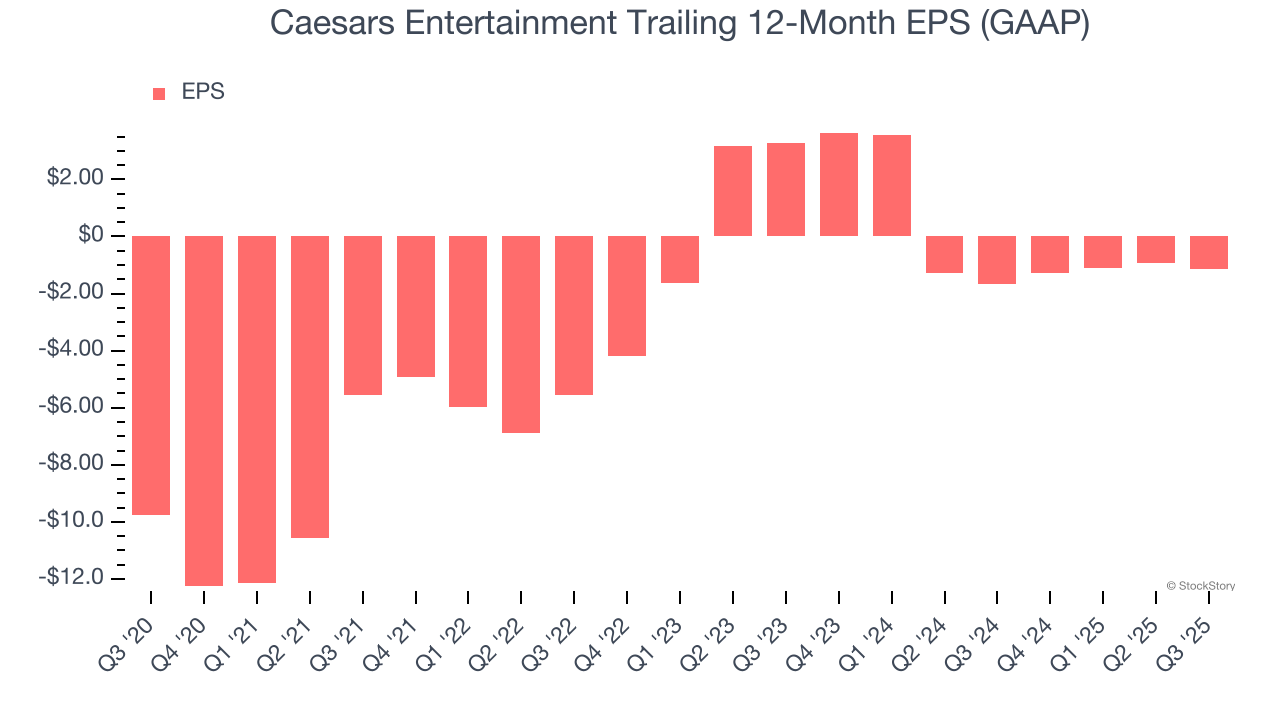
In Q3, Caesars Entertainment reported EPS of negative $0.27, down from negative $0.04 in the same quarter last year. This print missed analysts’ estimates. Over the next 12 months, Wall Street is optimistic. Analysts forecast Caesars Entertainment’s full-year EPS of negative $1.15 will flip to positive $0.16.
Key Takeaways from Caesars Entertainment’s Q3 Results
We struggled to find many positives in these results. Its EPS missed and its EBITDA fell short of Wall Street’s estimates. Overall, this was a softer quarter. The stock traded down 6.4% to $20.65 immediately after reporting.
Caesars Entertainment may have had a tough quarter, but does that actually create an opportunity to invest right now? We think that the latest quarter is only one piece of the longer-term business quality puzzle. Quality, when combined with valuation, can help determine if the stock is a buy. We cover that in our actionable full research report which you can read here, it’s free for active Edge members.