Heating, ventilation, air conditioning, and refrigeration company Carrier Global (NYSE: CARR) met Wall Street’s revenue expectations in Q3 CY2025, but sales fell by 6.8% year on year to $5.58 billion. The company’s full-year revenue guidance of $22.5 billion at the midpoint came in 1.4% above analysts’ estimates. Its non-GAAP profit of $0.67 per share was 17.7% above analysts’ consensus estimates.
Is now the time to buy Carrier Global? Find out by accessing our full research report, it’s free for active Edge members.
Carrier Global (CARR) Q3 CY2025 Highlights:
- Revenue: $5.58 billion vs analyst estimates of $5.56 billion (6.8% year-on-year decline, in line)
- Adjusted EPS: $0.67 vs analyst estimates of $0.57 (17.7% beat)
- Adjusted EBITDA: $875 million vs analyst estimates of $1.03 billion (15.7% margin, 14.9% miss)
- The company dropped its revenue guidance for the full year to $22.5 billion at the midpoint from $23 billion, a 2.2% decrease
- Management lowered its full-year Adjusted EPS guidance to $2.65 at the midpoint, a 13.1% decrease
- Operating Margin: 9.7%, down from 12.7% in the same quarter last year
- Free Cash Flow was $224 million, up from -$356 million in the same quarter last year
- Organic Revenue fell 4% year on year vs analyst estimates of 5.3% declines (126.3 basis point beat)
- Market Capitalization: $49.61 billion
"Our team drove continued double-digit aftermarket growth and strong performance in Commercial HVAC1, which grew 30% in the Americas, both of which were more than offset by expected weakness in Residential in the Americas," said Chairman & CEO David Gitlin.
Company Overview
Founded by the inventor of air conditioning, Carrier Global (NYSE: CARR) manufactures heating, ventilation, air conditioning, and refrigeration products.
Revenue Growth
Examining a company’s long-term performance can provide clues about its quality. Any business can have short-term success, but a top-tier one grows for years. Unfortunately, Carrier Global’s 4.9% annualized revenue growth over the last five years was tepid. This fell short of our benchmark for the industrials sector and is a poor baseline for our analysis.
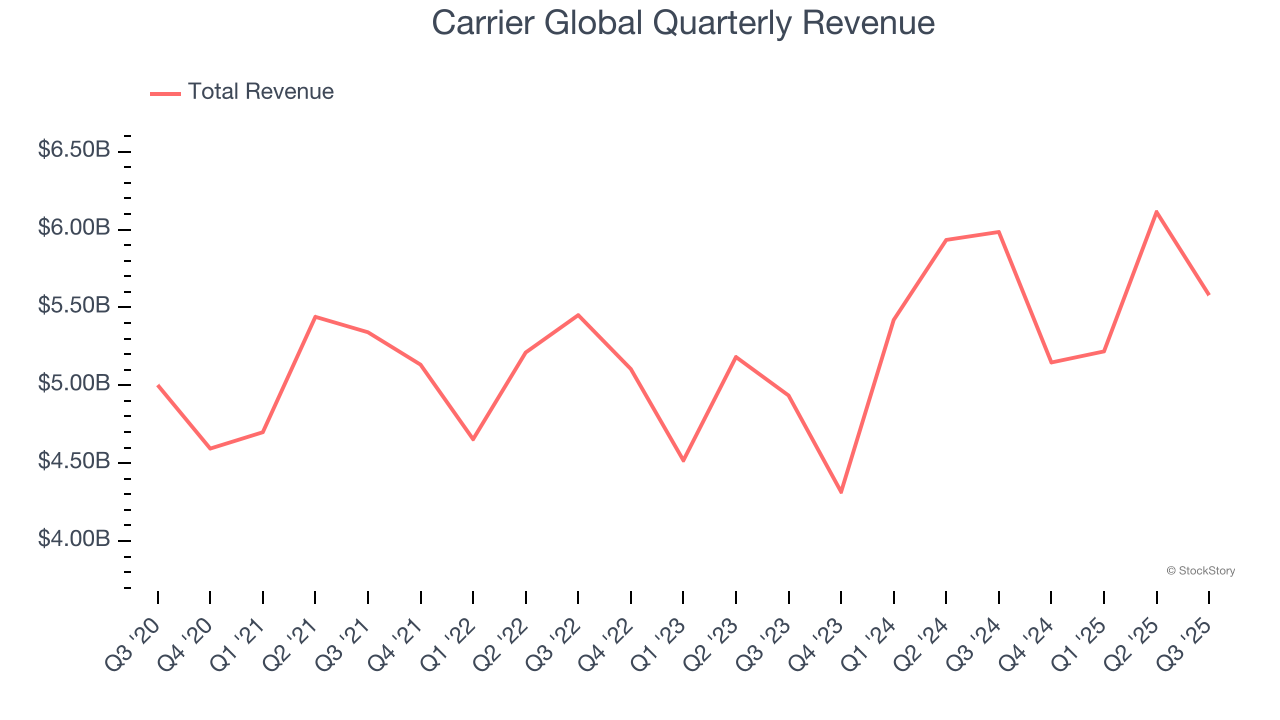
Long-term growth is the most important, but within industrials, a half-decade historical view may miss new industry trends or demand cycles. Carrier Global’s annualized revenue growth of 5.7% over the last two years aligns with its five-year trend, suggesting its demand was consistently weak. 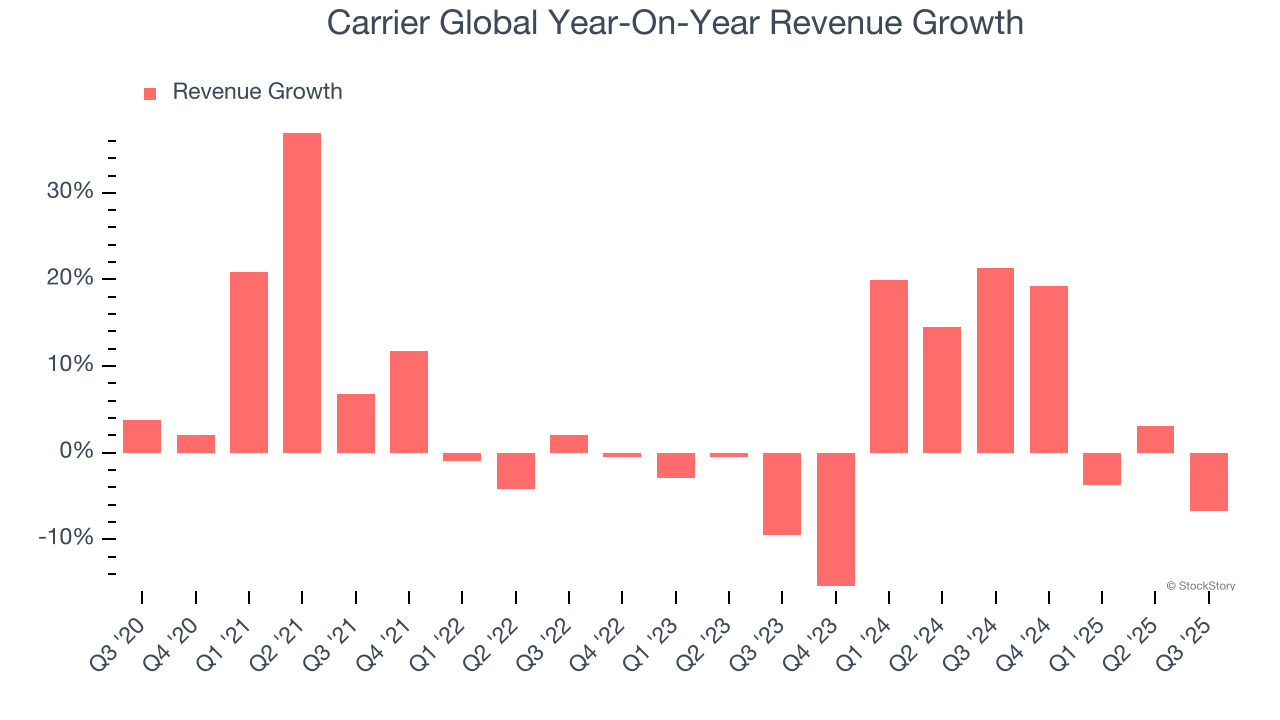
We can dig further into the company’s sales dynamics by analyzing its organic revenue, which strips out one-time events like acquisitions and currency fluctuations that don’t accurately reflect its fundamentals. Over the last two years, Carrier Global’s organic revenue averaged 2% year-on-year growth. Because this number is lower than its two-year revenue growth, we can see that some mixture of acquisitions and foreign exchange rates boosted its headline results. 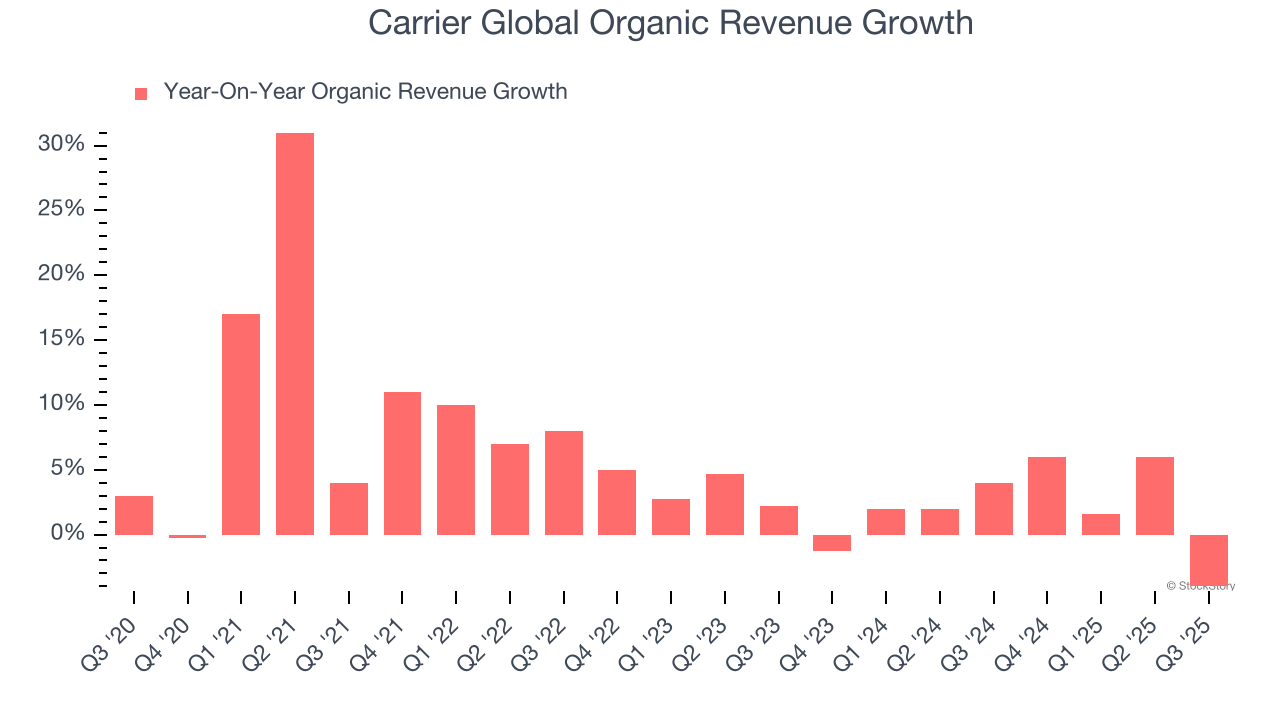
This quarter, Carrier Global reported a rather uninspiring 6.8% year-on-year revenue decline to $5.58 billion of revenue, in line with Wall Street’s estimates.
Looking ahead, sell-side analysts expect revenue to grow 5.2% over the next 12 months, similar to its two-year rate. This projection doesn't excite us and suggests its newer products and services will not accelerate its top-line performance yet.
Today’s young investors won’t have read the timeless lessons in Gorilla Game: Picking Winners In High Technology because it was written more than 20 years ago when Microsoft and Apple were first establishing their supremacy. But if we apply the same principles, then enterprise software stocks leveraging their own generative AI capabilities may well be the Gorillas of the future. So, in that spirit, we are excited to present our Special Free Report on a profitable, fast-growing enterprise software stock that is already riding the automation wave and looking to catch the generative AI next.
Operating Margin
Carrier Global has been an efficient company over the last five years. It was one of the more profitable businesses in the industrials sector, boasting an average operating margin of 14.7%. This result was particularly impressive because of its low gross margin, which is mostly a factor of what it sells and takes huge shifts to move meaningfully. Companies have more control over their operating margins, and it’s a show of well-managed operations if they’re high when gross margins are low.
Looking at the trend in its profitability, Carrier Global’s operating margin decreased by 4.2 percentage points over the last five years. This raises questions about the company’s expense base because its revenue growth should have given it leverage on its fixed costs, resulting in better economies of scale and profitability.
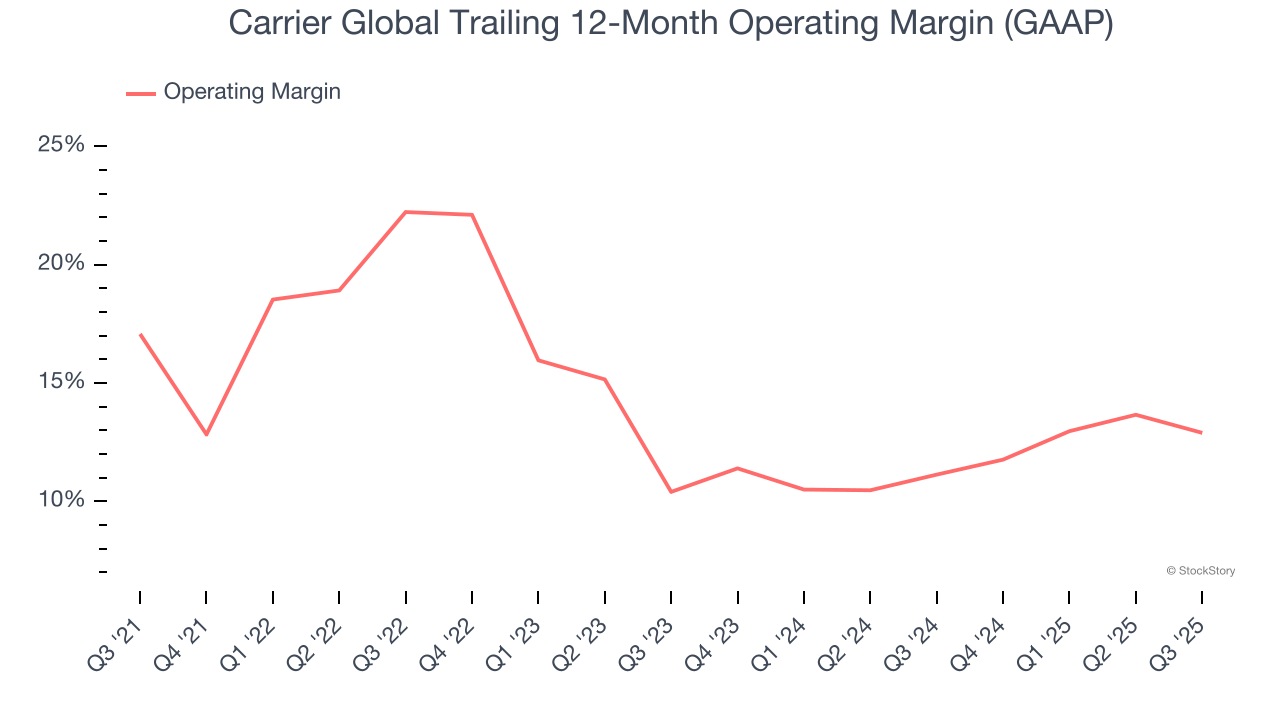
This quarter, Carrier Global generated an operating margin profit margin of 9.7%, down 3.1 percentage points year on year. The contraction shows it was less efficient because its expenses increased relative to its revenue.
Earnings Per Share
We track the long-term change in earnings per share (EPS) for the same reason as long-term revenue growth. Compared to revenue, however, EPS highlights whether a company’s growth is profitable.
Carrier Global’s EPS grew at a solid 10.7% compounded annual growth rate over the last five years, higher than its 4.9% annualized revenue growth. However, this alone doesn’t tell us much about its business quality because its operating margin didn’t improve.
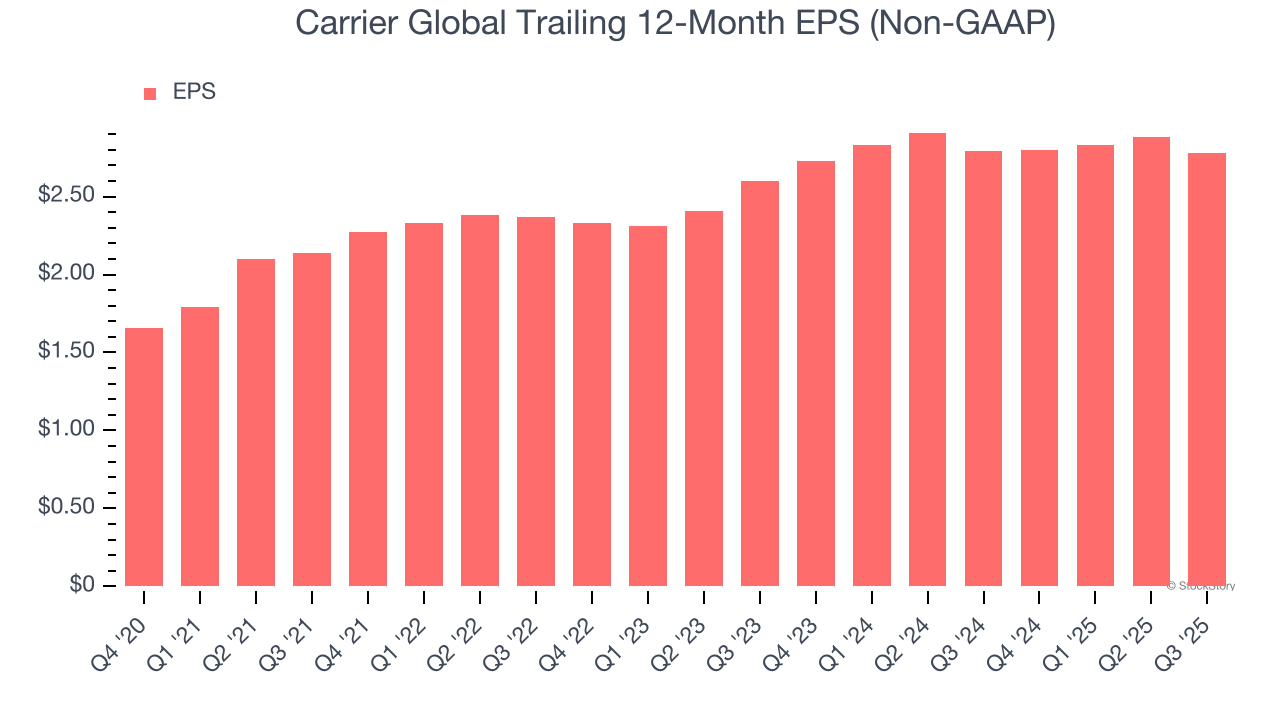
We can take a deeper look into Carrier Global’s earnings to better understand the drivers of its performance. A five-year view shows that Carrier Global has repurchased its stock, shrinking its share count by 2.6%. This tells us its EPS outperformed its revenue not because of increased operational efficiency but financial engineering, as buybacks boost per share earnings. 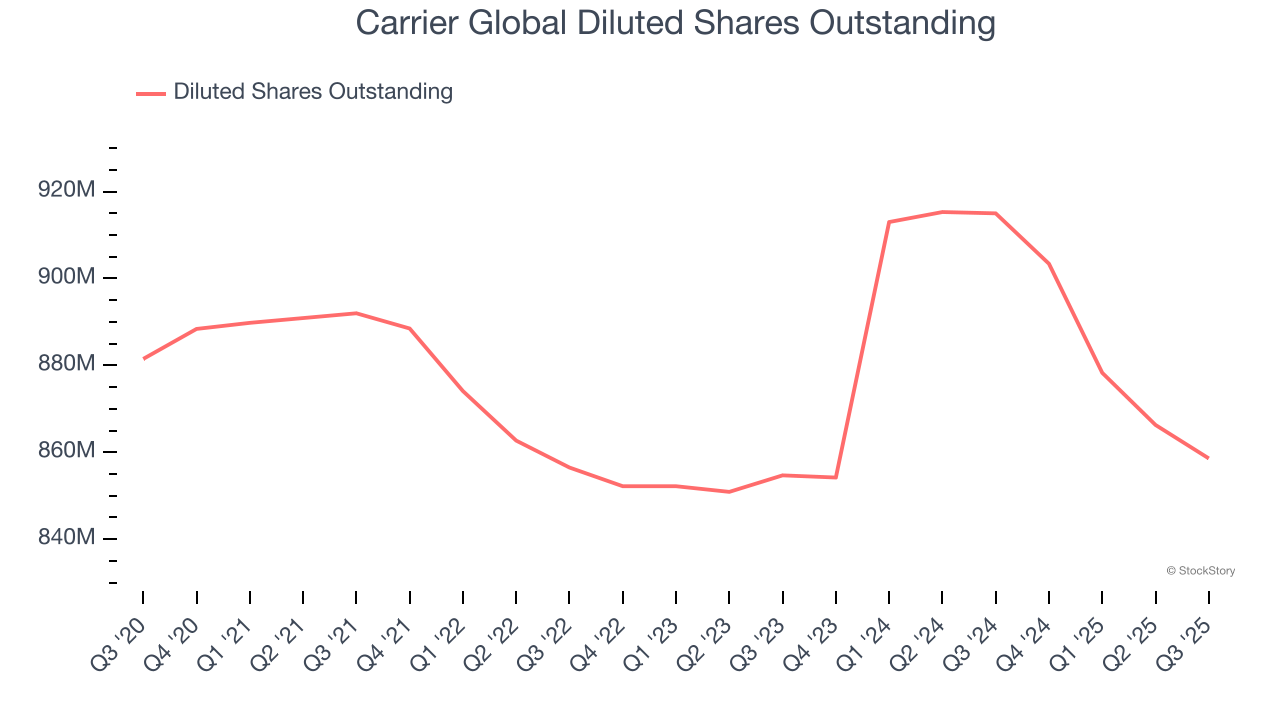
Like with revenue, we analyze EPS over a more recent period because it can provide insight into an emerging theme or development for the business.
For Carrier Global, its two-year annual EPS growth of 3.4% was lower than its five-year trend. We hope its growth can accelerate in the future.
In Q3, Carrier Global reported adjusted EPS of $0.67, down from $0.77 in the same quarter last year. Despite falling year on year, this print easily cleared analysts’ estimates. Over the next 12 months, Wall Street expects Carrier Global’s full-year EPS of $2.78 to grow 9.1%.
Key Takeaways from Carrier Global’s Q3 Results
It was good to see Carrier Global beat analysts’ EPS expectations this quarter. We were also glad its full-year revenue guidance slightly exceeded Wall Street’s estimates. On the other hand, its full-year revenue guidance was lowered and its full-year EPS guidance fell short of Wall Street’s estimates. The market seems willing to forgive the outlook and focus on the EPS beat in the quarter. The stock traded up 5.1% to $61.23 immediately following the results.
Is Carrier Global an attractive investment opportunity at the current price? The latest quarter does matter, but not nearly as much as longer-term fundamentals and valuation, when deciding if the stock is a buy. We cover that in our actionable full research report which you can read here, it’s free for active Edge members.