
Although F.N.B. Corporation (currently trading at $15.71 per share) has gained 17.6% over the last six months, it has trailed the S&P 500’s 24.4% return during that period. This may have investors wondering how to approach the situation.
Is there a buying opportunity in F.N.B. Corporation, or does it present a risk to your portfolio? Dive into our full research report to see our analyst team’s opinion, it’s free for active Edge members.
Why Is F.N.B. Corporation Not Exciting?
We don't have much confidence in F.N.B. Corporation. Here are three reasons why FNB doesn't excite us and a stock we'd rather own.
1. Revenue Growth Flatlining
We at StockStory place the most emphasis on long-term growth, but within financials, a stretched historical view may miss recent interest rate changes, market returns, and industry trends. F.N.B. Corporation’s recent performance shows its demand has slowed as its revenue was flat over the last two years. 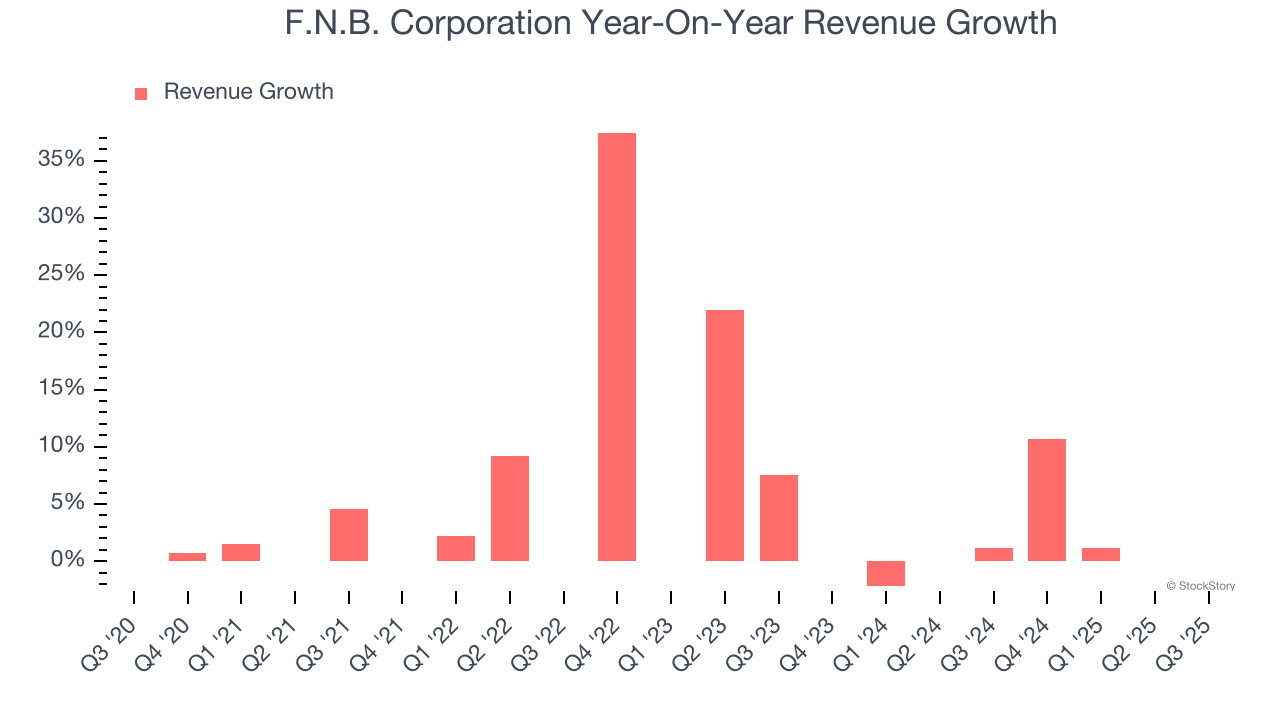 Note: Quarters not shown were determined to be outliers, impacted by outsized investment gains/losses that are not indicative of the recurring fundamentals of the business.
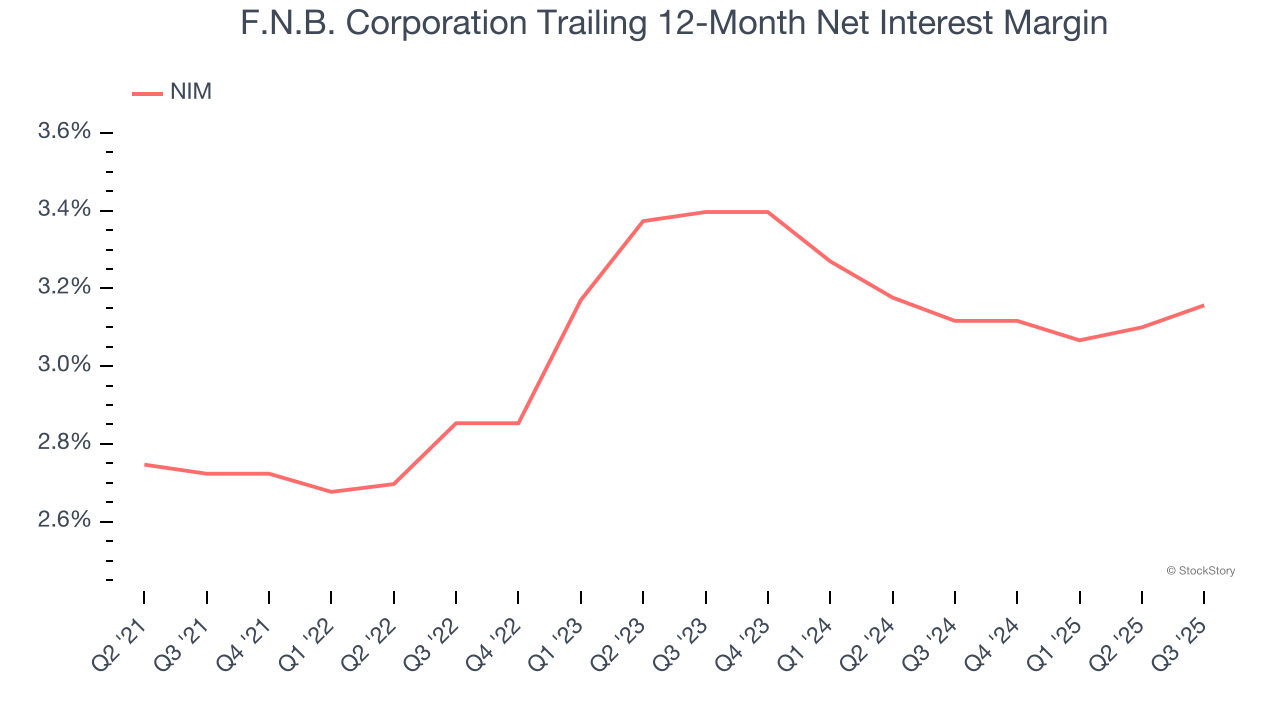
2. Net Interest Margin Dropping
The net interest margin (NIM) is a key profitability indicator that measures the difference between what a bank earns on its loans and what it pays on its deposits. This metric measures how efficiently one can generate income from its core lending activities.
Over the past two years, F.N.B. Corporation’s net interest margin averaged 3.1%. Its margin also contracted by 24 basis points (100 basis points = 1 percentage point) over that period.
This decline was a headwind for its net interest income. While prevailing rates are a major determinant of net interest margin changes over time, the decline could mean that F.N.B. Corporation either faced competition for loans and deposits or experienced a negative mix shift in its balance sheet composition.
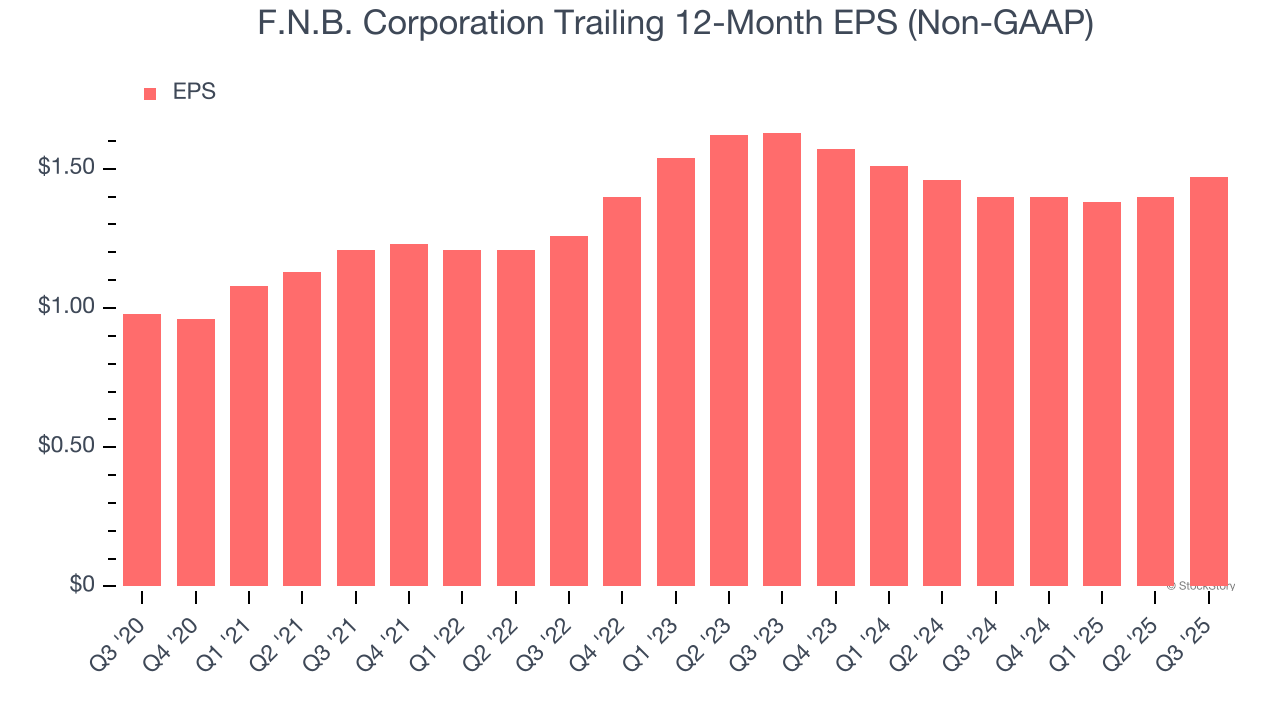
3. EPS Took a Dip Over the Last Two Years
While long-term earnings trends give us the big picture, we also track EPS over a shorter period because it can provide insight into an emerging theme or development for the business.
Sadly for F.N.B. Corporation, its EPS declined by 5% annually over the last two years while its revenue was flat. This tells us the company struggled to adjust to choppy demand.
Final Judgment
F.N.B. Corporation isn’t a terrible business, but it doesn’t pass our quality test. With its shares lagging the market recently, the stock trades at 0.8× forward P/B (or $15.71 per share). While this valuation is fair, the upside isn’t great compared to the potential downside. We're pretty confident there are superior stocks to buy right now. Let us point you toward a safe-and-steady industrials business benefiting from an upgrade cycle.
High-Quality Stocks for All Market Conditions
Donald Trump’s April 2025 "Liberation Day" tariffs sent markets into a tailspin, but stocks have since rebounded strongly, proving that knee-jerk reactions often create the best buying opportunities.
The smart money is already positioning for the next leg up. Don’t miss out on the recovery - check out our Top 5 Growth Stocks for this month. This is a curated list of our High Quality stocks that have generated a market-beating return of 183% over the last five years (as of March 31st 2025).
Stocks that made our list in 2020 include now familiar names such as Nvidia (+1,545% between March 2020 and March 2025) as well as under-the-radar businesses like the once-micro-cap company Kadant (+351% five-year return). Find your next big winner with StockStory today.
StockStory is growing and hiring equity analyst and marketing roles. Are you a 0 to 1 builder passionate about the markets and AI? See the open roles here.


