Off-Road and powersports vehicle corporation Polaris (NYSE: PII) reported Q3 CY2025 results topping the market’s revenue expectations, with sales up 5.4% year on year to $1.84 billion. The company’s full-year revenue guidance of $7 billion at the midpoint came in 0.5% above analysts’ estimates. Its non-GAAP profit of $0.41 per share was 92.8% above analysts’ consensus estimates.
Is now the time to buy Polaris? Find out by accessing our full research report, it’s free for active Edge members.
Polaris (PII) Q3 CY2025 Highlights:
- Revenue: $1.84 billion vs analyst estimates of $1.79 billion (5.4% year-on-year growth, 2.6% beat)
- Adjusted EPS: $0.41 vs analyst estimates of $0.21 (92.8% beat)
- Adjusted EBITDA: $140.4 million vs analyst estimates of $113.4 million (7.6% margin, 23.8% beat)
- Operating Margin: 1.1%, down from 3.8% in the same quarter last year
- Free Cash Flow was $116.7 million, up from -$32.4 million in the same quarter last year
- Market Capitalization: $4.00 billion
Company Overview
Founded in 1954, Polaris (NYSE: PII) designs and manufactures high-performance off-road vehicles, snowmobiles, and motorcycles.
Revenue Growth
Reviewing a company’s long-term sales performance reveals insights into its quality. Any business can have short-term success, but a top-tier one grows for years. Over the last five years, Polaris grew its sales at a weak 1.1% compounded annual growth rate. This fell short of our benchmarks and is a tough starting point for our analysis.
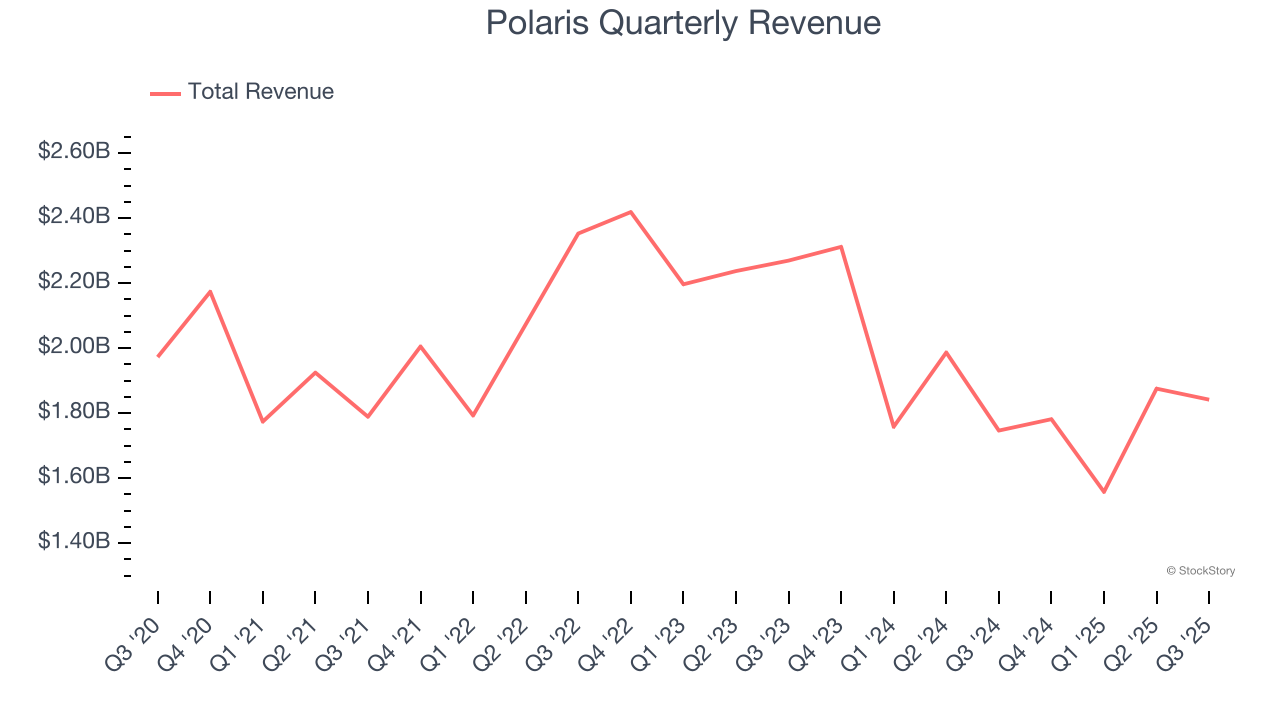
We at StockStory place the most emphasis on long-term growth, but within consumer discretionary, a stretched historical view may miss a company riding a successful new product or trend. Polaris’s performance shows it grew in the past but relinquished its gains over the last two years, as its revenue fell by 12% annually. 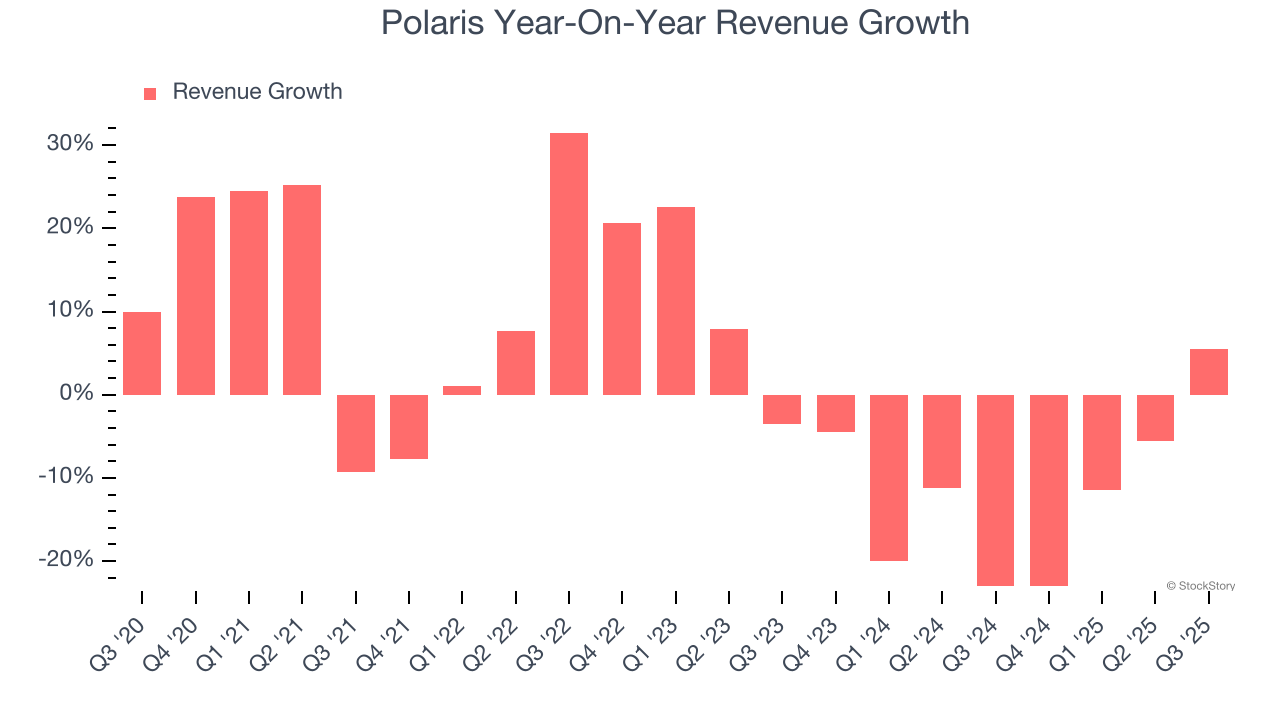
This quarter, Polaris reported year-on-year revenue growth of 5.4%, and its $1.84 billion of revenue exceeded Wall Street’s estimates by 2.6%.
Looking ahead, sell-side analysts expect revenue to remain flat over the next 12 months. Although this projection suggests its newer products and services will catalyze better top-line performance, it is still below average for the sector.
Here at StockStory, we certainly understand the potential of thematic investing. Diverse winners from Microsoft (MSFT) to Alphabet (GOOG), Coca-Cola (KO) to Monster Beverage (MNST) could all have been identified as promising growth stories with a megatrend driving the growth. So, in that spirit, we’ve identified a relatively under-the-radar profitable growth stock benefiting from the rise of AI, available to you FREE via this link.
Operating Margin
Polaris’s operating margin has shrunk over the last 12 months and averaged 3.1% over the last two years. The company’s profitability was mediocre for a consumer discretionary business and shows it couldn’t pass its higher operating expenses onto its customers.
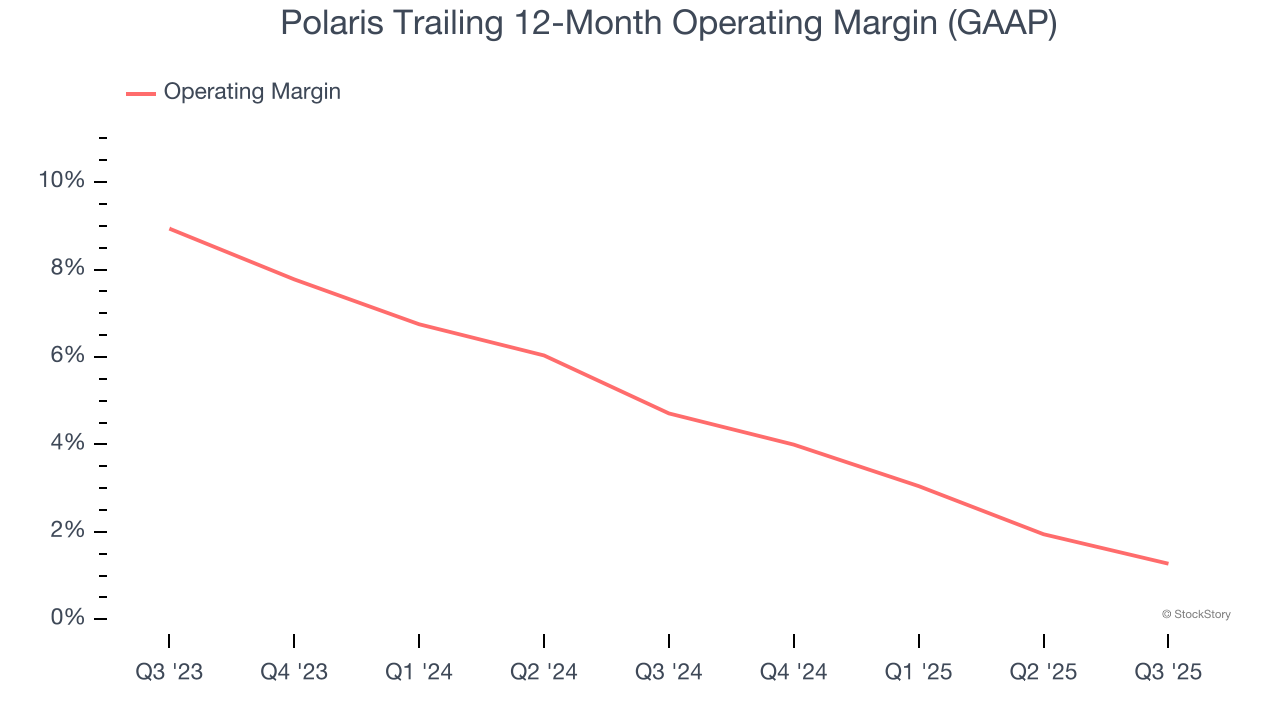
In Q3, Polaris generated an operating margin profit margin of 1.1%, down 2.7 percentage points year on year. This contraction shows it was less efficient because its expenses grew faster than its revenue.
Earnings Per Share
Revenue trends explain a company’s historical growth, but the long-term change in earnings per share (EPS) points to the profitability of that growth – for example, a company could inflate its sales through excessive spending on advertising and promotions.
Sadly for Polaris, its EPS declined by 33.1% annually over the last five years while its revenue grew by 1.1%. This tells us the company became less profitable on a per-share basis as it expanded due to non-fundamental factors such as interest expenses and taxes.
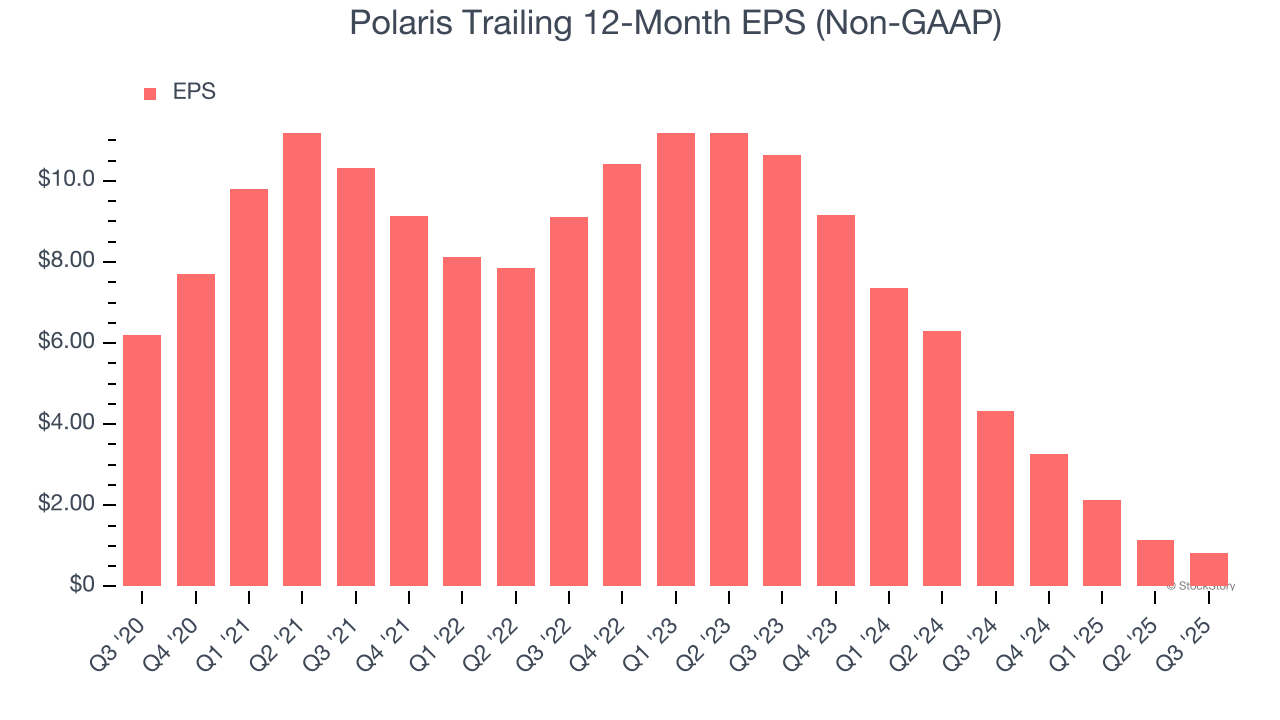
In Q3, Polaris reported adjusted EPS of $0.41, down from $0.73 in the same quarter last year. Despite falling year on year, this print easily cleared analysts’ estimates. Over the next 12 months, Wall Street expects Polaris’s full-year EPS of $0.83 to grow 7.5%.
Key Takeaways from Polaris’s Q3 Results
It was good to see Polaris beat analysts’ EPS expectations this quarter. We were also glad its EBITDA outperformed Wall Street’s estimates. Zooming out, we think this was a solid print. The stock remained flat at $71 immediately after reporting.
Is Polaris an attractive investment opportunity at the current price? If you’re making that decision, you should consider the bigger picture of valuation, business qualities, as well as the latest earnings. We cover that in our actionable full research report which you can read here, it’s free for active Edge members.