Casino resort and entertainment company Red Rock Resorts (NASDAQ: RRR) missed Wall Street’s revenue expectations in Q3 CY2025 as sales only rose 1.6% year on year to $475.6 million. Its GAAP profit of $0.68 per share was 76.4% above analysts’ consensus estimates.
Is now the time to buy Red Rock Resorts? Find out by accessing our full research report, it’s free for active Edge members.
Red Rock Resorts (RRR) Q3 CY2025 Highlights:
- Revenue: $475.6 million vs analyst estimates of $479.6 million (1.6% year-on-year growth, 0.8% miss)
- EPS (GAAP): $0.68 vs analyst estimates of $0.39 (76.4% beat)
- Adjusted EBITDA: $190.9 million vs analyst estimates of $186.9 million (40.1% margin, 2.1% beat)
- Operating Margin: 27.6%, in line with the same quarter last year
- Market Capitalization: $3.43 billion
Company Overview
Founded in 1976, Red Rock Resorts (NASDAQ: RRR) operates a range of casino resorts and entertainment properties, primarily in the Las Vegas metropolitan area.
Revenue Growth
Examining a company’s long-term performance can provide clues about its quality. Any business can put up a good quarter or two, but the best consistently grow over the long haul. Over the last five years, Red Rock Resorts grew its sales at a sluggish 9% compounded annual growth rate. This was below our standard for the consumer discretionary sector and is a rough starting point for our analysis.
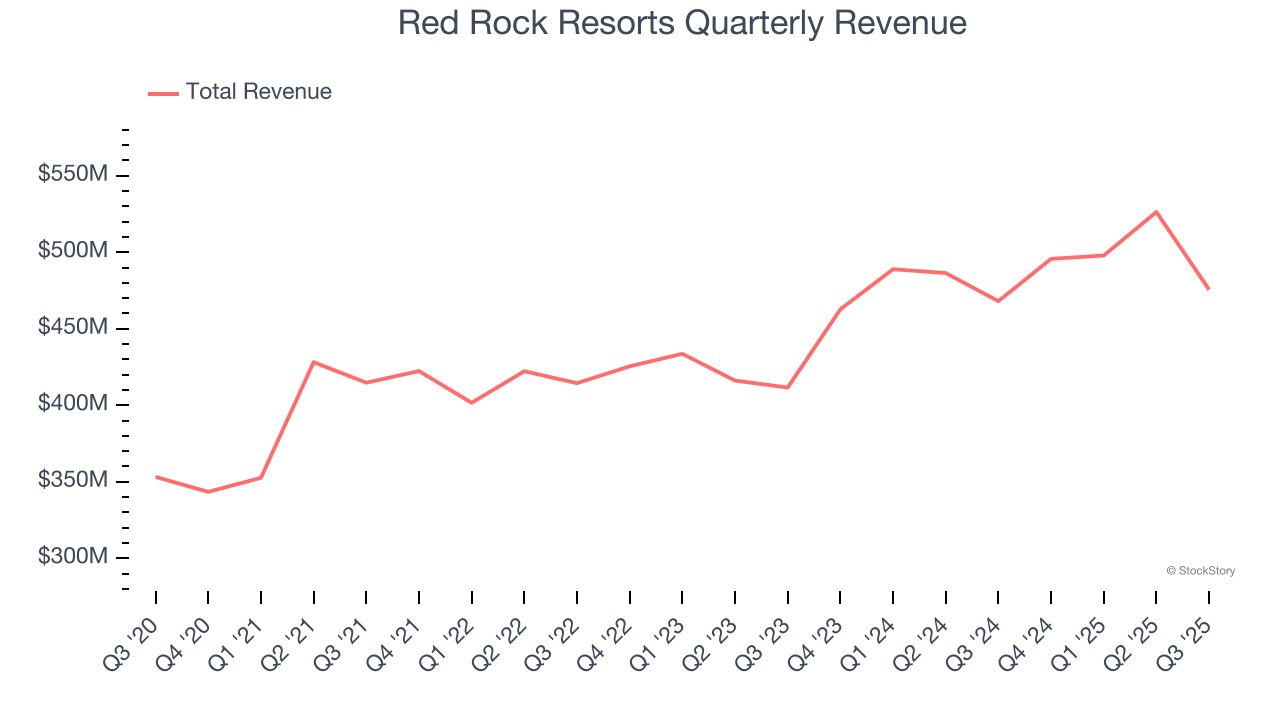
We at StockStory place the most emphasis on long-term growth, but within consumer discretionary, a stretched historical view may miss a company riding a successful new product or trend. Red Rock Resorts’s annualized revenue growth of 8.8% over the last two years aligns with its five-year trend, suggesting its demand was consistently weak. Note that COVID hurt Red Rock Resorts’s business in 2020 and part of 2021, and it bounced back in a big way thereafter. 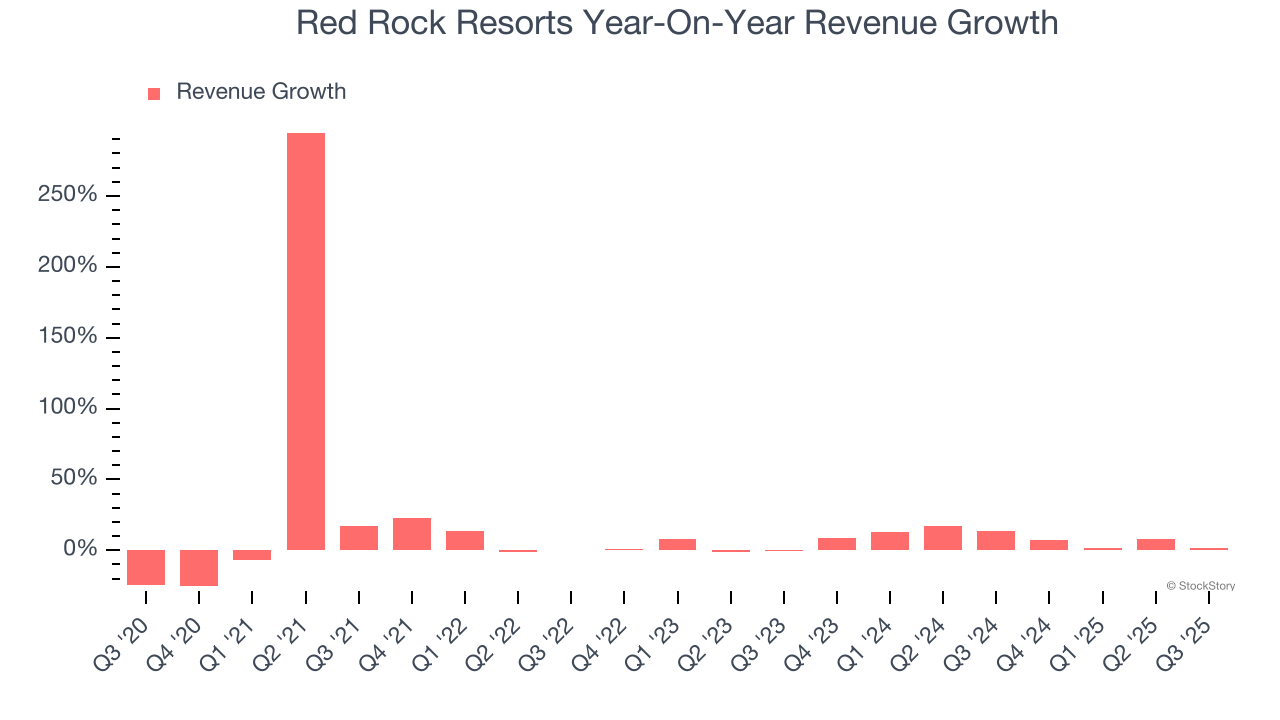
We can better understand the company’s revenue dynamics by analyzing its three most important segments: Casino, Dining, and Hotel, which are 67.2%, 18%, and 8.7% of revenue. Over the last two years, Red Rock Resorts’s revenues in all three segments increased. Its Casino revenue (Blackjack, Poker) averaged year-on-year growth of 9.1% while its Dining (food and beverage) and Hotel (overnight stays) revenues averaged 9.6% and 5.8%. 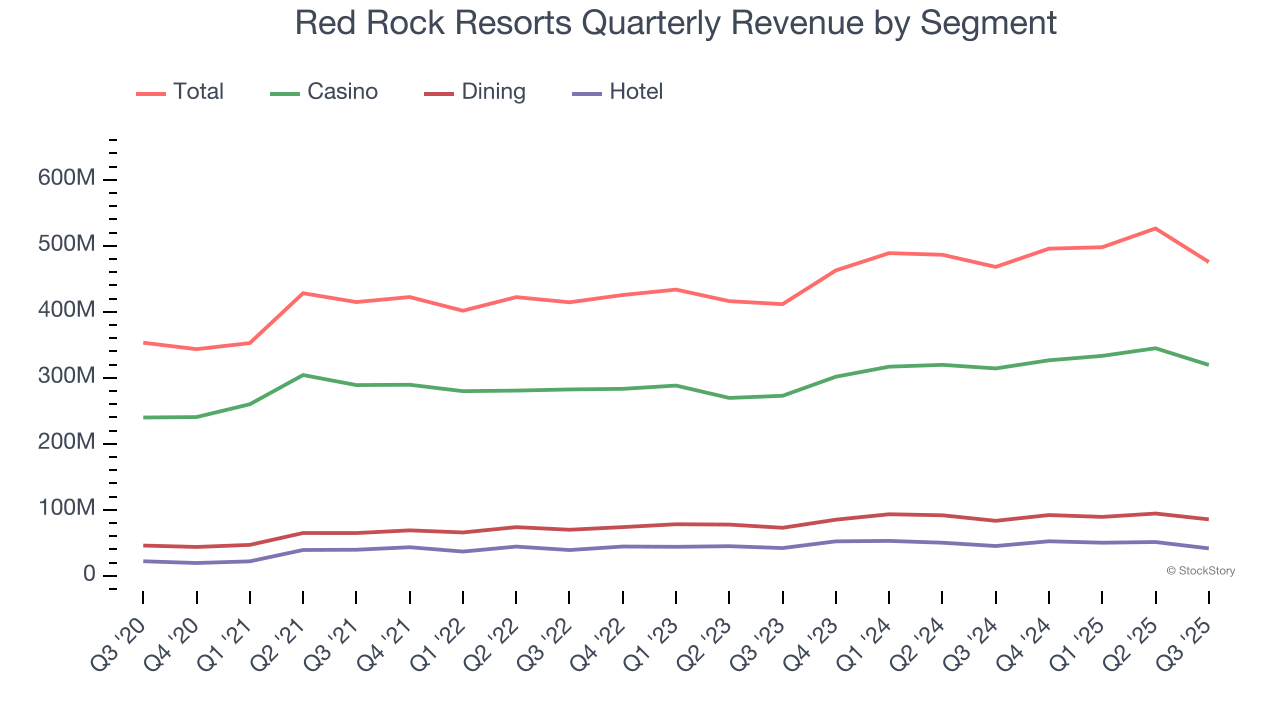
This quarter, Red Rock Resorts’s revenue grew by 1.6% year on year to $475.6 million, falling short of Wall Street’s estimates.
Looking ahead, sell-side analysts expect revenue to grow 2.5% over the next 12 months, a deceleration versus the last two years. This projection doesn't excite us and implies its products and services will see some demand headwinds.
Here at StockStory, we certainly understand the potential of thematic investing. Diverse winners from Microsoft (MSFT) to Alphabet (GOOG), Coca-Cola (KO) to Monster Beverage (MNST) could all have been identified as promising growth stories with a megatrend driving the growth. So, in that spirit, we’ve identified a relatively under-the-radar profitable growth stock benefiting from the rise of AI, available to you FREE via this link.
Operating Margin
Red Rock Resorts’s operating margin has shrunk over the last 12 months, but it still averaged 30.7% over the last two years, elite for a consumer discretionary business. This shows it’s an well-run company with an efficient cost structure.
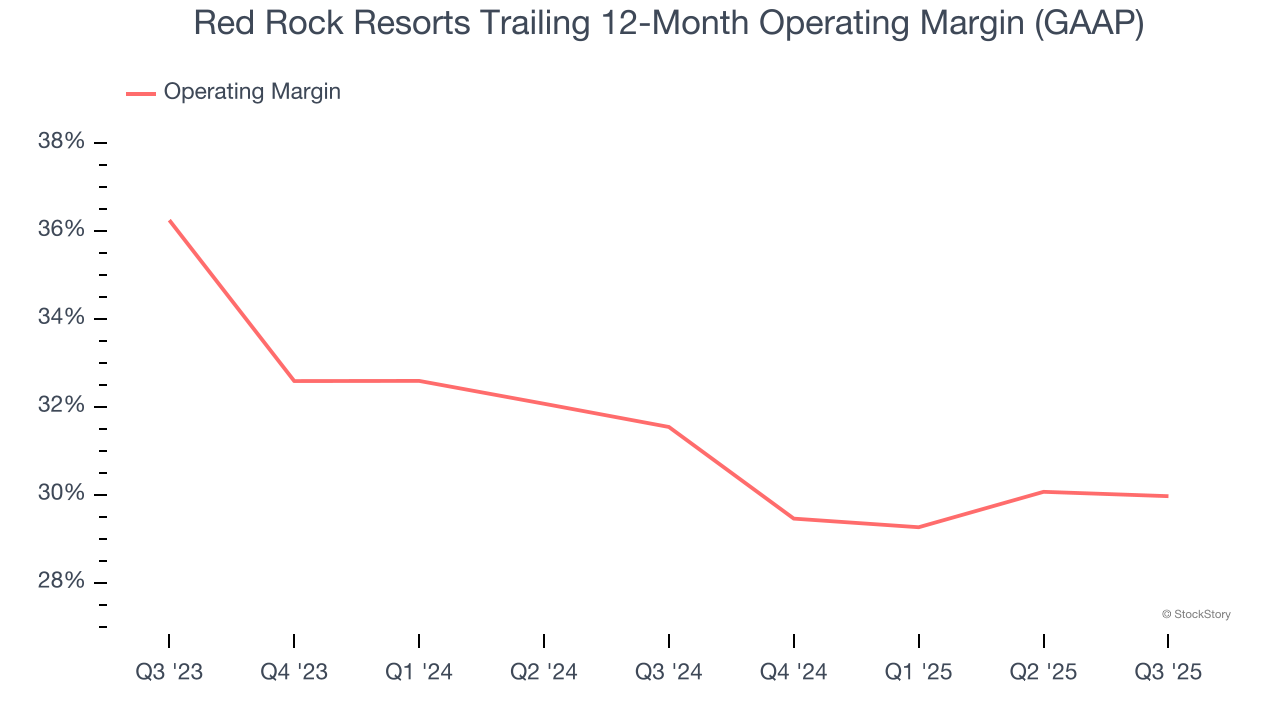
This quarter, Red Rock Resorts generated an operating margin profit margin of 27.6%, in line with the same quarter last year. This indicates the company’s overall cost structure has been relatively stable.
Earnings Per Share
Revenue trends explain a company’s historical growth, but the long-term change in earnings per share (EPS) points to the profitability of that growth – for example, a company could inflate its sales through excessive spending on advertising and promotions.
Red Rock Resorts’s full-year EPS flipped from negative to positive over the last five years. This is encouraging and shows it’s at a critical moment in its life.
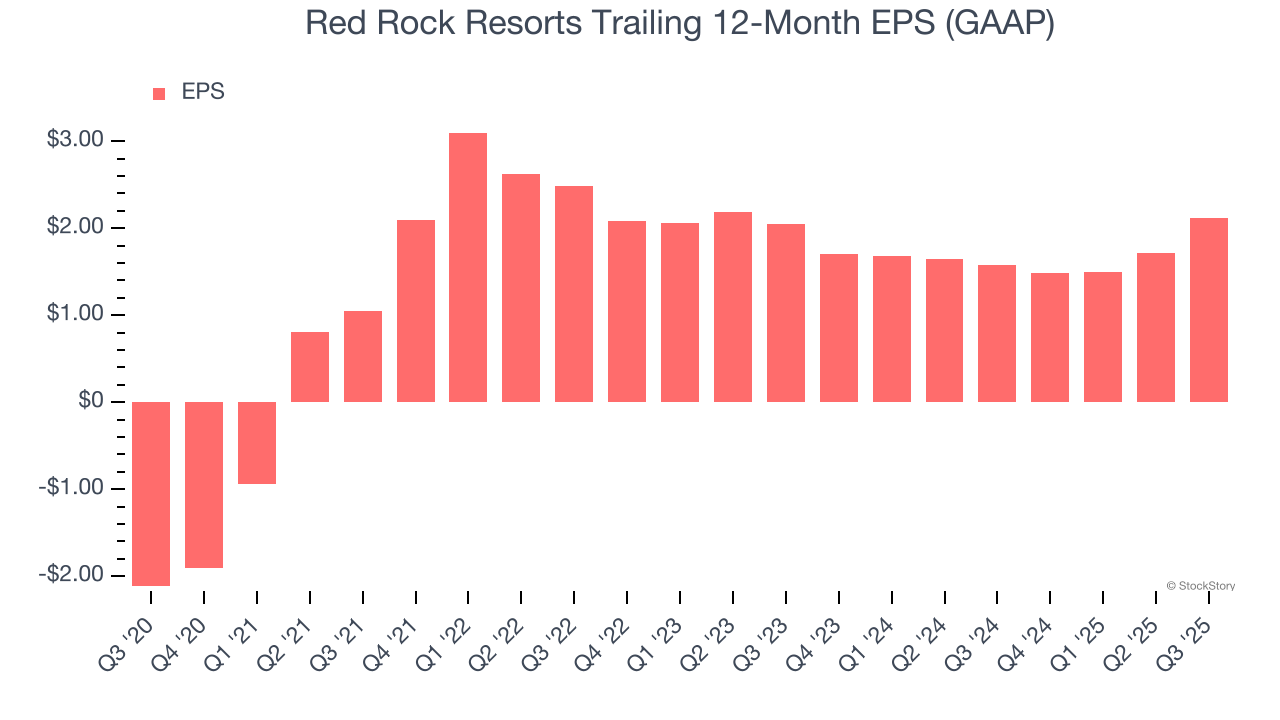
In Q3, Red Rock Resorts reported EPS of $0.68, up from $0.28 in the same quarter last year. This print easily cleared analysts’ estimates, and shareholders should be content with the results. Over the next 12 months, Wall Street expects Red Rock Resorts’s full-year EPS of $2.11 to shrink by 3.5%.
Key Takeaways from Red Rock Resorts’s Q3 Results
It was good to see Red Rock Resorts beat analysts’ EPS expectations this quarter. On the other hand, its revenue fell slightly short of Wall Street’s estimates. Overall, this print was mixed. The market seemed to be hoping for more, and the stock traded down 2.1% to $58 immediately after reporting.
So do we think Red Rock Resorts is an attractive buy at the current price? The latest quarter does matter, but not nearly as much as longer-term fundamentals and valuation, when deciding if the stock is a buy. We cover that in our actionable full research report which you can read here, it’s free for active Edge members.