
Water analytics and treatment company Veralto (NYSE: VLTO) met Wall Street’s revenue expectations in Q3 CY2025, with sales up 6.8% year on year to $1.40 billion. On the other hand, next quarter’s revenue guidance of $1.38 billion was less impressive, coming in 1.4% below analysts’ estimates. Its non-GAAP profit of $0.99 per share was 4.6% above analysts’ consensus estimates.
Is now the time to buy Veralto? Find out by accessing our full research report, it’s free for active Edge members.
Veralto (VLTO) Q3 CY2025 Highlights:
- Revenue: $1.40 billion vs analyst estimates of $1.4 billion (6.8% year-on-year growth, in line)
- Adjusted EPS: $0.99 vs analyst estimates of $0.95 (4.6% beat)
- Revenue Guidance for Q4 CY2025 is $1.38 billion at the midpoint, below analyst estimates of $1.40 billion
- Management raised its full-year Adjusted EPS guidance to $3.84 at the midpoint, a 2% increase
- Operating Margin: 23.2%, in line with the same quarter last year
- Free Cash Flow Margin: 18.4%, up from 16.4% in the same quarter last year
- Market Capitalization: $25.84 billion
Company Overview
Spun off from Danaher in 2023, Veralto (NYSE: VLTO) provides water analytics and treatment solutions.
Revenue Growth
A company’s long-term performance is an indicator of its overall quality. Any business can have short-term success, but a top-tier one grows for years. Regrettably, Veralto’s sales grew at a sluggish 4.4% compounded annual growth rate over the last four years. This was below our standard for the industrials sector and is a rough starting point for our analysis.
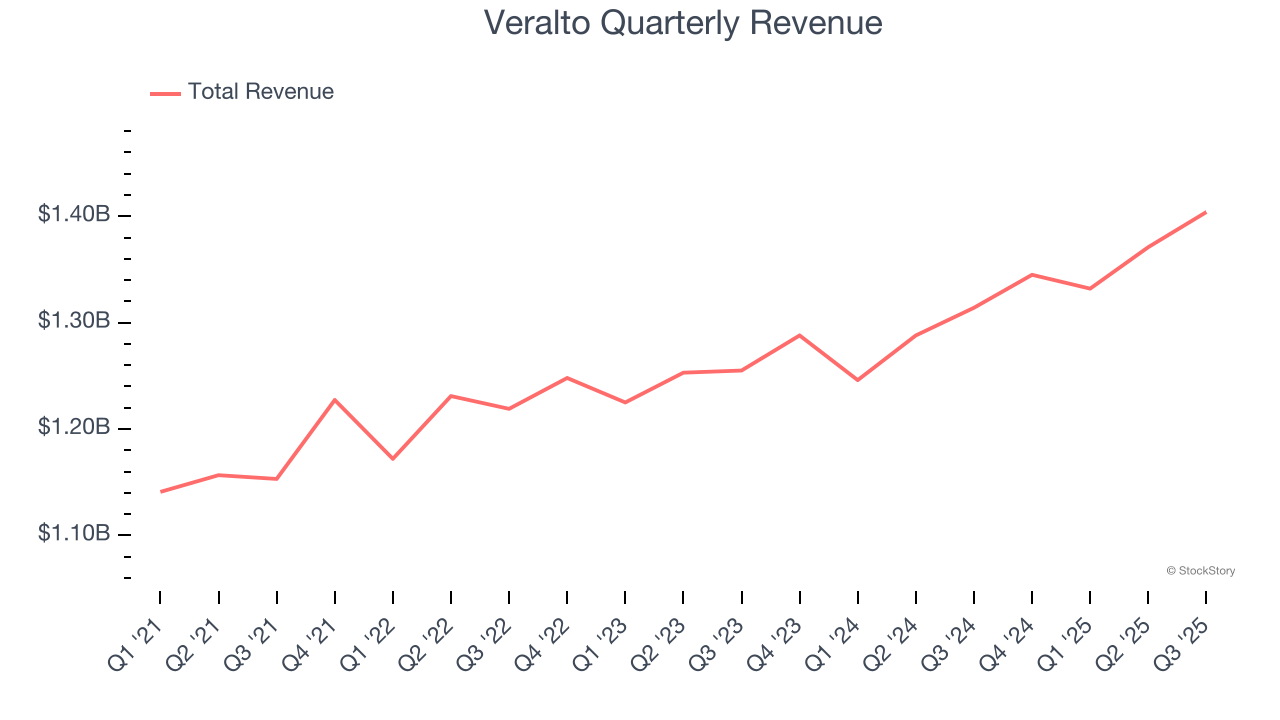
We at StockStory place the most emphasis on long-term growth, but within industrials, a stretched historical view may miss cycles, industry trends, or a company capitalizing on catalysts such as a new contract win or a successful product line. Veralto’s annualized revenue growth of 4.6% over the last two years aligns with its four-year trend, suggesting its demand was consistently weak. 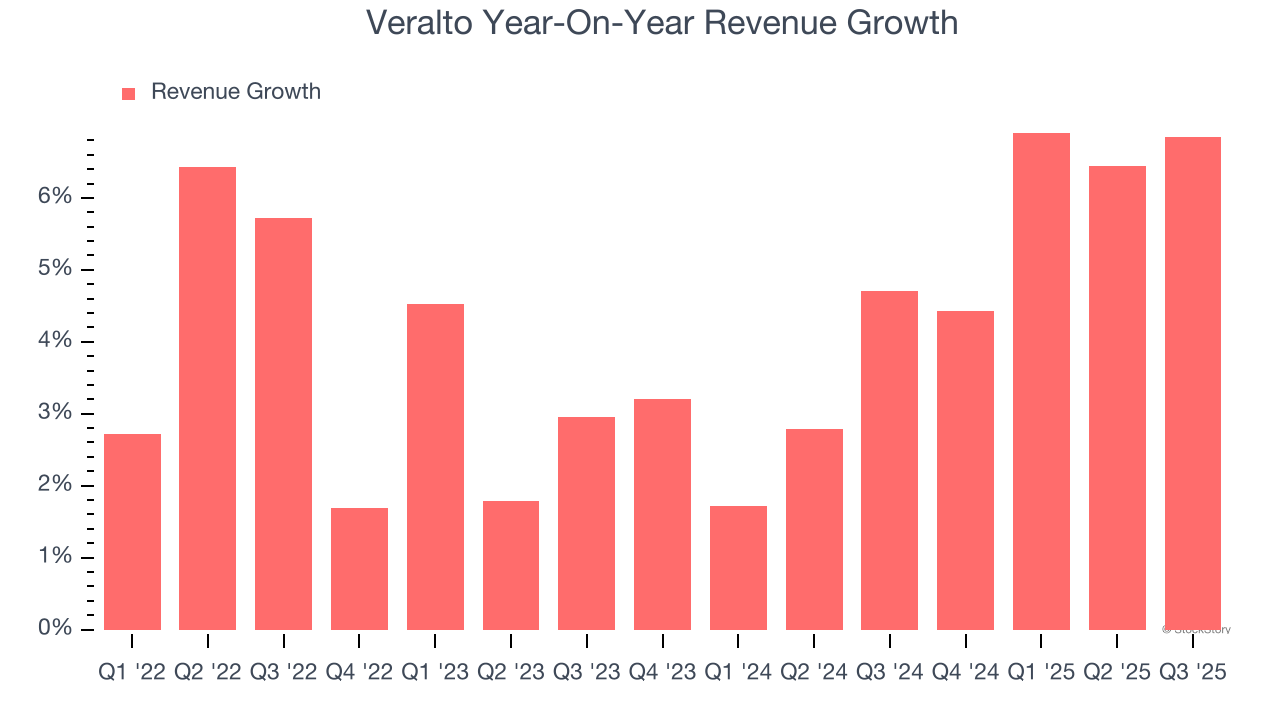
This quarter, Veralto grew its revenue by 6.8% year on year, and its $1.40 billion of revenue was in line with Wall Street’s estimates. Company management is currently guiding for a 2.5% year-on-year increase in sales next quarter.
Looking further ahead, sell-side analysts expect revenue to grow 5% over the next 12 months, similar to its two-year rate. This projection doesn't excite us and indicates its newer products and services will not lead to better top-line performance yet.
Software is eating the world and there is virtually no industry left that has been untouched by it. That drives increasing demand for tools helping software developers do their jobs, whether it be monitoring critical cloud infrastructure, integrating audio and video functionality, or ensuring smooth content streaming. Click here to access a free report on our 3 favorite stocks to play this generational megatrend.
Operating Margin
Operating margin is a key measure of profitability. Think of it as net income - the bottom line - excluding the impact of taxes and interest on debt, which are less connected to business fundamentals.
Veralto’s operating margin might fluctuated slightly over the last 12 months but has remained more or less the same, averaging 22.9% over the last five years. This profitability was elite for an industrials business thanks to its efficient cost structure and economies of scale. This result isn’t surprising as its high gross margin gives it a favorable starting point.
Analyzing the trend in its profitability, Veralto’s operating margin might fluctuated slightly but has generally stayed the same over the last five years. We like to see margin expansion, but we’re still happy with Veralto’s performance considering most Air and Water Services companies saw their margins plummet.
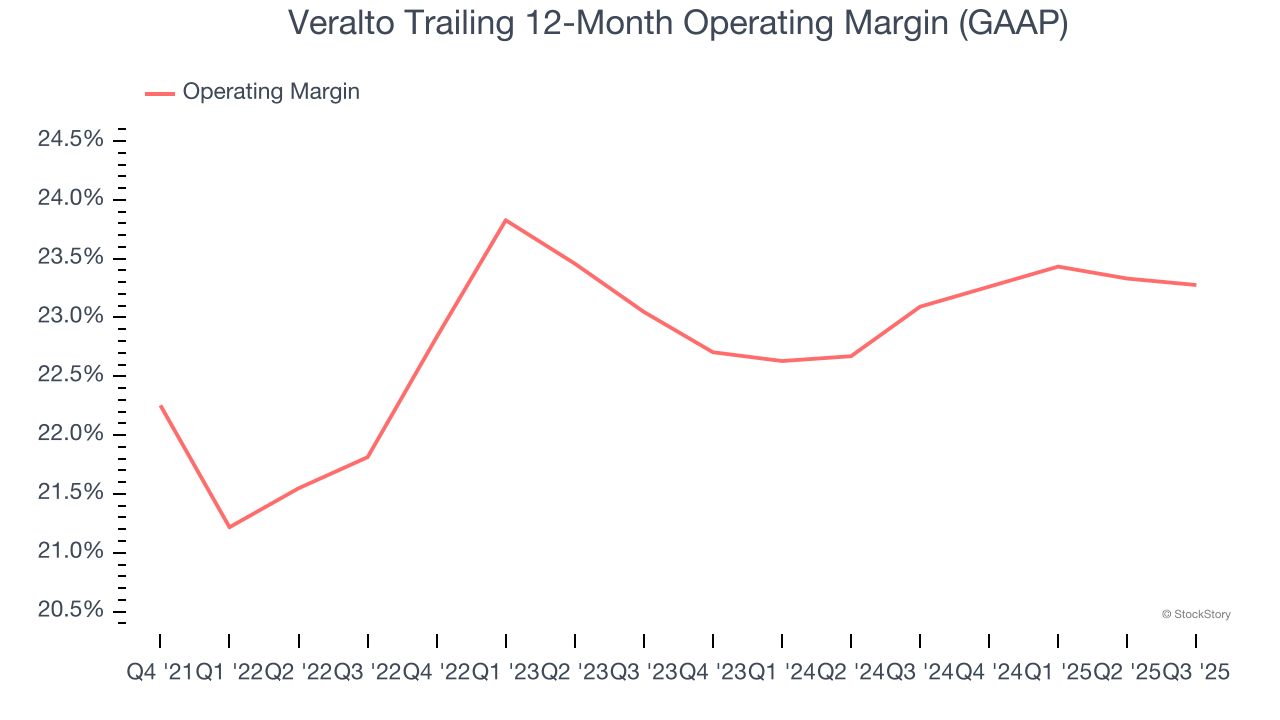
This quarter, Veralto generated an operating margin profit margin of 23.2%, in line with the same quarter last year. This indicates the company’s cost structure has recently been stable.
Cash Is King
Although earnings are undoubtedly valuable for assessing company performance, we believe cash is king because you can’t use accounting profits to pay the bills.
Veralto has shown terrific cash profitability, putting it in an advantageous position to invest in new products, return capital to investors, and consolidate the market during industry downturns. The company’s free cash flow margin was among the best in the industrials sector, averaging 17.5% over the last five years.
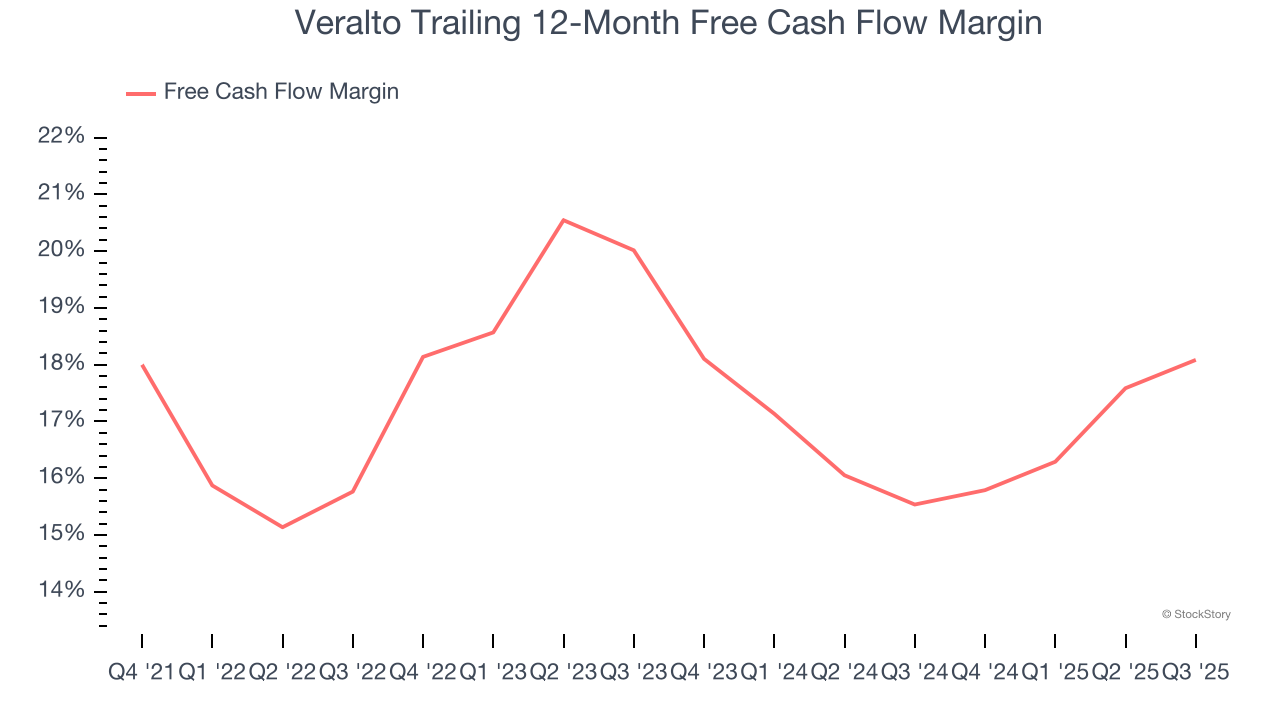
Veralto’s free cash flow clocked in at $258 million in Q3, equivalent to a 18.4% margin. This result was good as its margin was 2 percentage points higher than in the same quarter last year, but we wouldn’t read too much into the short term because investment needs can be seasonal, causing temporary swings. Long-term trends are more important.
Key Takeaways from Veralto’s Q3 Results
It was good to see Veralto provide full-year EPS guidance that slightly beat analysts’ expectations. We were also glad its EPS outperformed Wall Street’s estimates. On the other hand, its revenue guidance for next quarter slightly missed. Overall, this print was mixed. The stock remained flat at $103 immediately following the results.
Is Veralto an attractive investment opportunity right now? If you’re making that decision, you should consider the bigger picture of valuation, business qualities, as well as the latest earnings. We cover that in our actionable full research report which you can read here, it’s free for active Edge members.


