
Stitch Fix has had an impressive run over the past six months as its shares have beaten the S&P 500 by 13.6%. The stock now trades at $4.58, marking a 37.5% gain. This was partly due to its solid quarterly results, and the run-up might have investors contemplating their next move.
Is now the time to buy Stitch Fix, or should you be careful about including it in your portfolio? See what our analysts have to say in our full research report, it’s free for active Edge members.
Why Do We Think Stitch Fix Will Underperform?
We’re glad investors have benefited from the price increase, but we're sitting this one out for now. Here are three reasons there are better opportunities than SFIX and a stock we'd rather own.
1. Decline in Active Clients Points to Weak Demand
Revenue growth can be broken down into changes in price and volume (for companies like Stitch Fix, our preferred volume metric is active clients). While both are important, the latter is the most critical to analyze because prices have a ceiling.
Stitch Fix’s active clients came in at 2.31 million in the latest quarter, and over the last two years, averaged 15.5% year-on-year declines. This performance was underwhelming and implies there may be increasing competition or market saturation. It also suggests Stitch Fix might have to lower prices or invest in product improvements to grow, factors that can hinder near-term profitability. 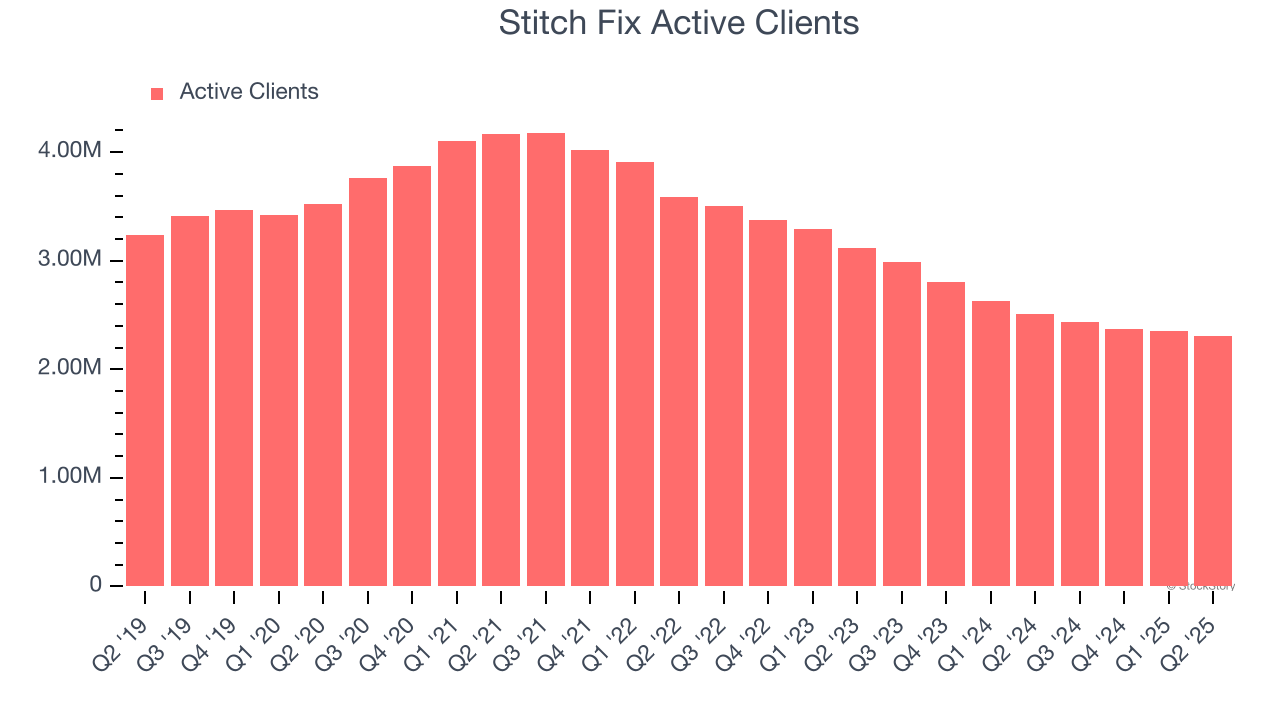
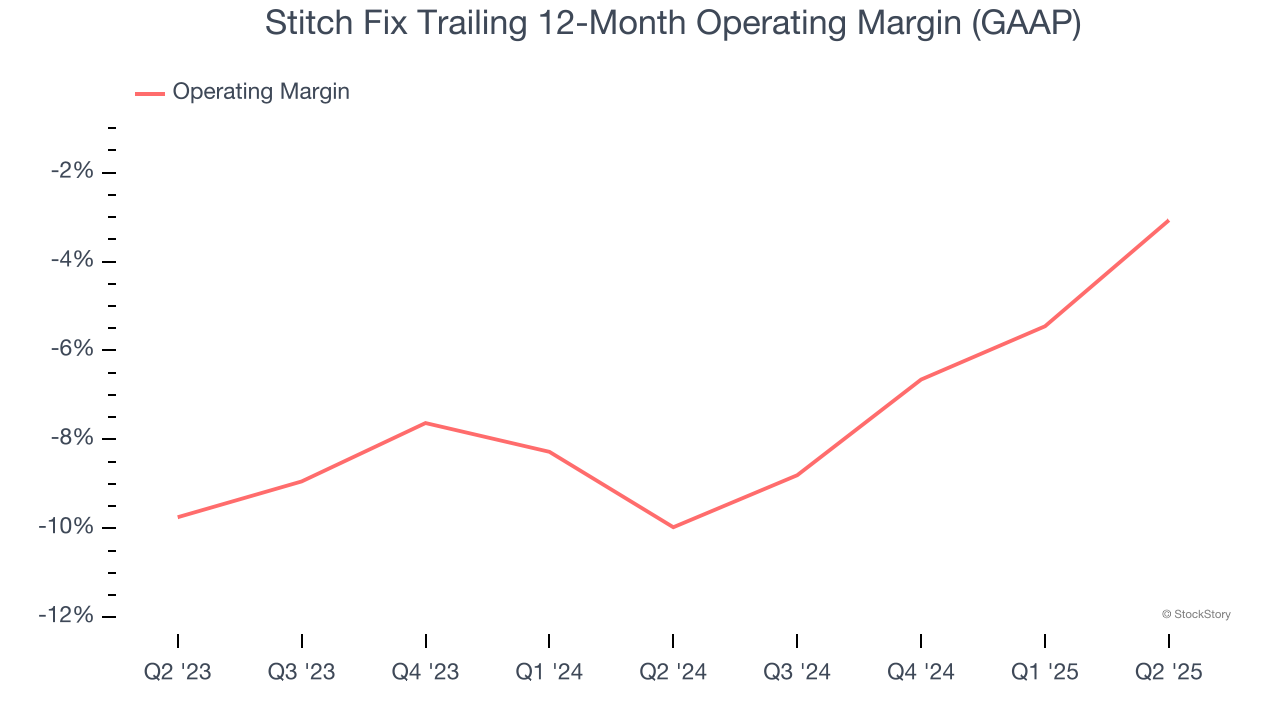
2. Operating Losses Sound the Alarms
Operating margin is a key measure of profitability. Think of it as net income - the bottom line - excluding the impact of taxes and interest on debt, which are less connected to business fundamentals.
Stitch Fix’s operating margin has been trending up over the last 12 months, but it still averaged negative 6.6% over the last two years. This is due to its large expense base and inefficient cost structure.
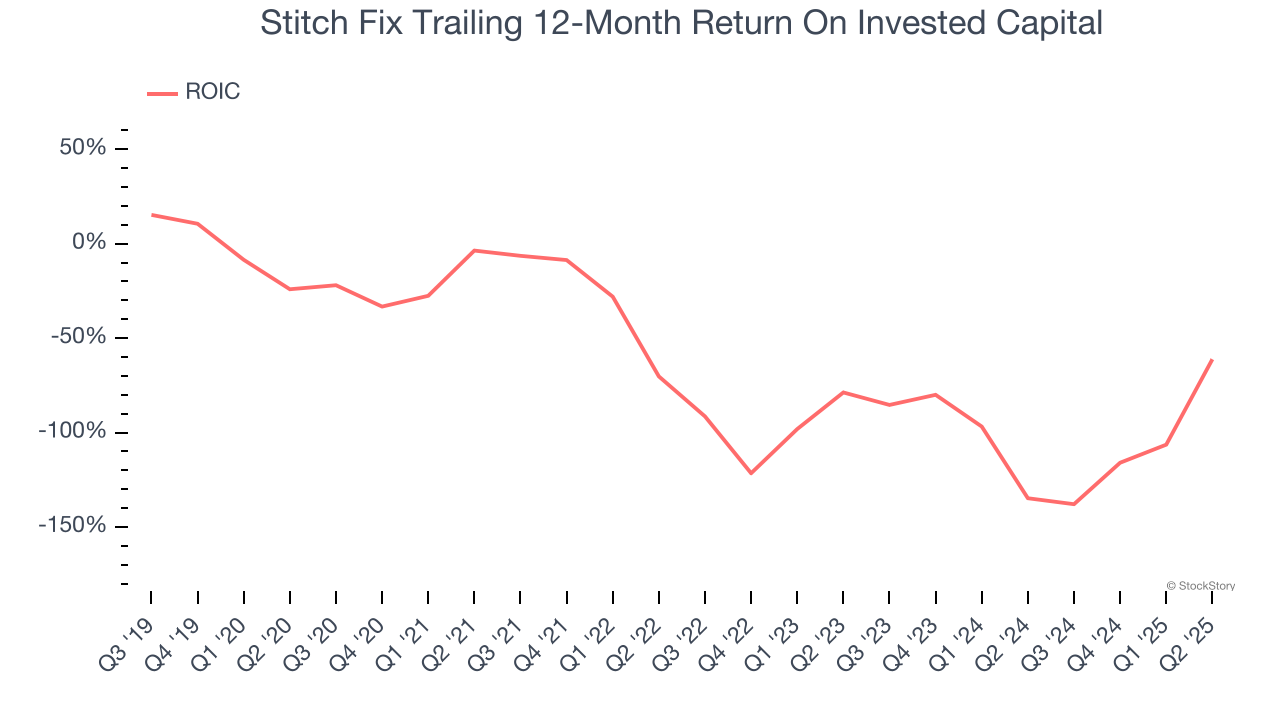
3. New Investments Fail to Bear Fruit as ROIC Declines
A company’s ROIC, or return on invested capital, shows how much operating profit it makes compared to the money it has raised (debt and equity).
We like to invest in businesses with high returns, but the trend in a company’s ROIC is what often surprises the market and moves the stock price. Unfortunately, Stitch Fix’s ROIC has decreased significantly over the last few years. Paired with its already low returns, these declines suggest its profitable growth opportunities are few and far between.
Final Judgment
We see the value of companies helping consumers, but in the case of Stitch Fix, we’re out. With its shares outperforming the market lately, the stock trades at 16.7× forward EV-to-EBITDA (or $4.58 per share). This multiple tells us a lot of good news is priced in - we think other companies feature superior fundamentals at the moment. We’d recommend looking at one of our all-time favorite software stocks.
Stocks We Like More Than Stitch Fix
Donald Trump’s April 2025 "Liberation Day" tariffs sent markets into a tailspin, but stocks have since rebounded strongly, proving that knee-jerk reactions often create the best buying opportunities.
The smart money is already positioning for the next leg up. Don’t miss out on the recovery - check out our Top 5 Growth Stocks for this month. This is a curated list of our High Quality stocks that have generated a market-beating return of 183% over the last five years (as of March 31st 2025).
Stocks that made our list in 2020 include now familiar names such as Nvidia (+1,545% between March 2020 and March 2025) as well as under-the-radar businesses like the once-small-cap company Comfort Systems (+782% five-year return). Find your next big winner with StockStory today.
StockStory is growing and hiring equity analyst and marketing roles. Are you a 0 to 1 builder passionate about the markets and AI? See the open roles here.


