
What a brutal six months it’s been for Sprout Social. The stock has dropped 48.7% and now trades at $10.97, rattling many shareholders. This might have investors contemplating their next move.
Is now the time to buy Sprout Social, or should you be careful about including it in your portfolio? Check out our in-depth research report to see what our analysts have to say, it’s free for active Edge members.
Why Is Sprout Social Not Exciting?
Even with the cheaper entry price, we're cautious about Sprout Social. Here are three reasons you should be careful with SPT and a stock we'd rather own.
1. Weak Billings Point to Soft Demand
Billings is a non-GAAP metric that is often called “cash revenue” because it shows how much money the company has collected from customers in a certain period. This is different from revenue, which must be recognized in pieces over the length of a contract.
Sprout Social’s billings came in at $109 million in Q2, and over the last four quarters, its year-on-year growth averaged 11%. This performance was underwhelming and suggests that increasing competition is causing challenges in acquiring/retaining customers. 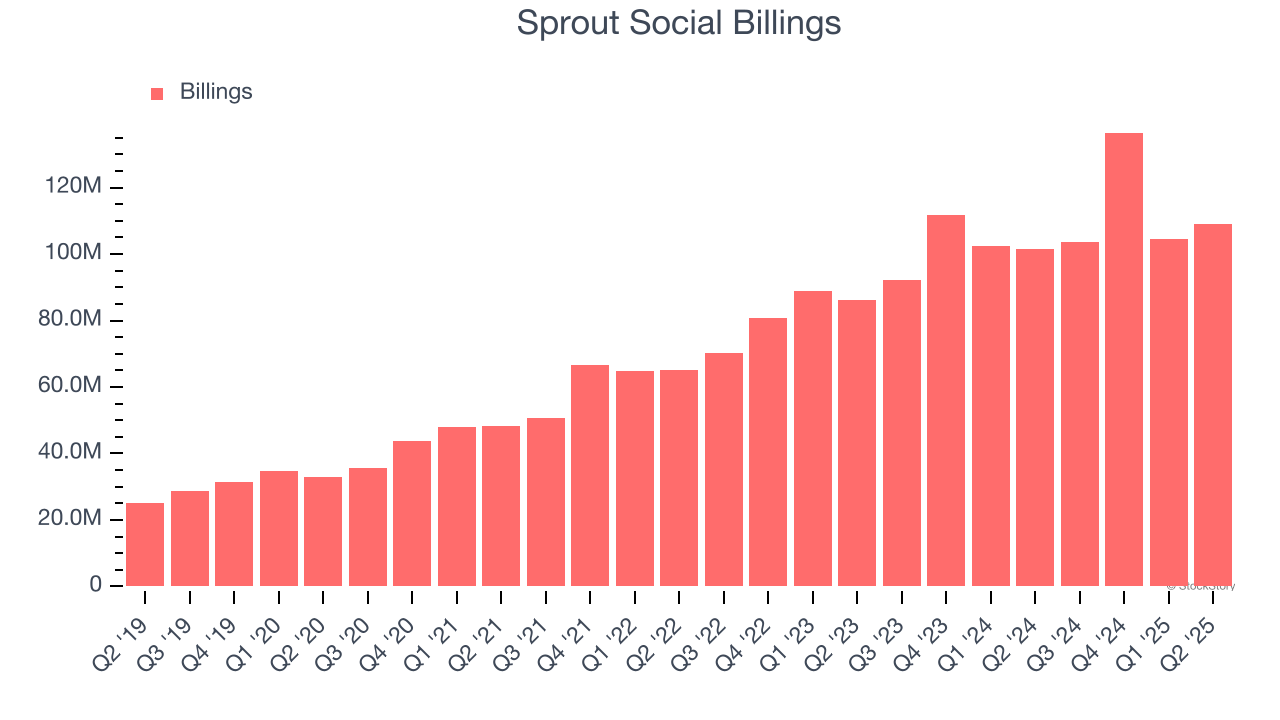
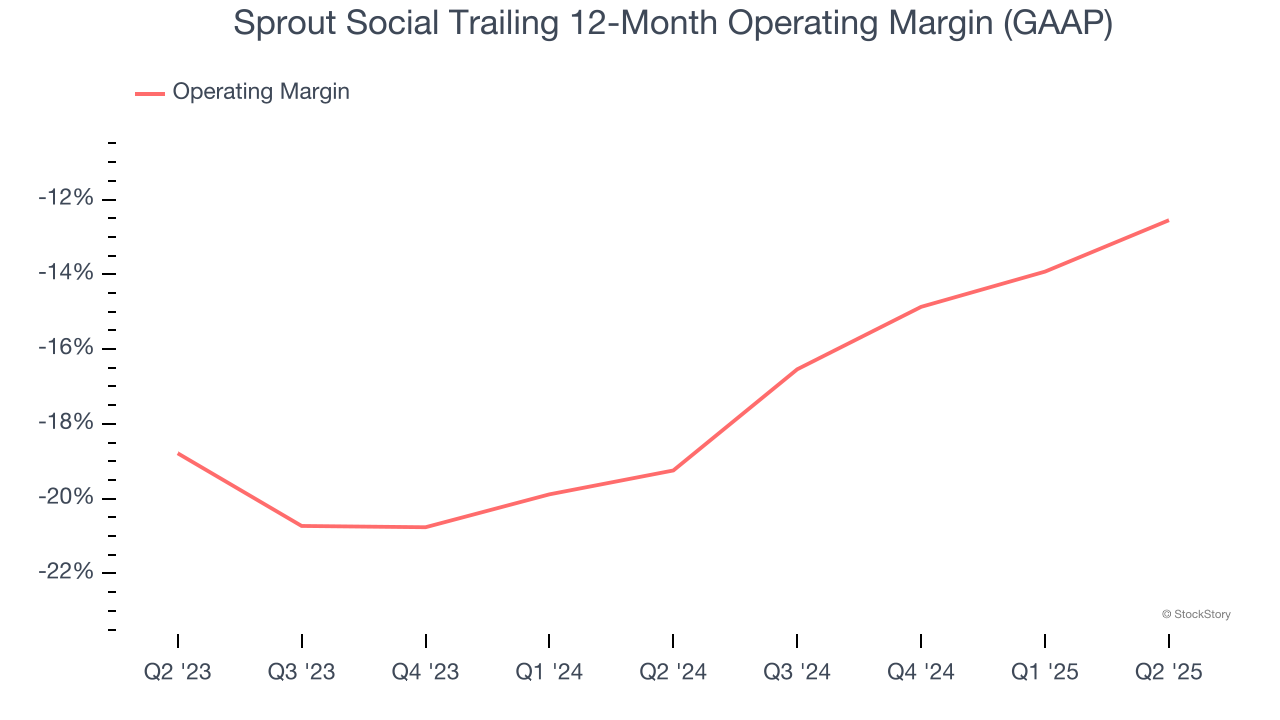
2. Operating Losses Sound the Alarms
Many software businesses adjust their profits for stock-based compensation (SBC), but we prioritize GAAP operating margin because SBC is a real expense used to attract and retain engineering and sales talent. This metric shows how much revenue remains after accounting for all core expenses – everything from the cost of goods sold to sales and R&D.
Sprout Social’s expensive cost structure has contributed to an average operating margin of negative 12.6% over the last year. Unprofitable, high-growth software companies require extra attention because they spend heaps of money to capture market share. As seen in its fast historical revenue growth, this strategy seems to have worked so far, but it’s unclear what would happen if Sprout Social reeled back its investments. Wall Street seems to think it will face some obstacles, and we tend to agree.
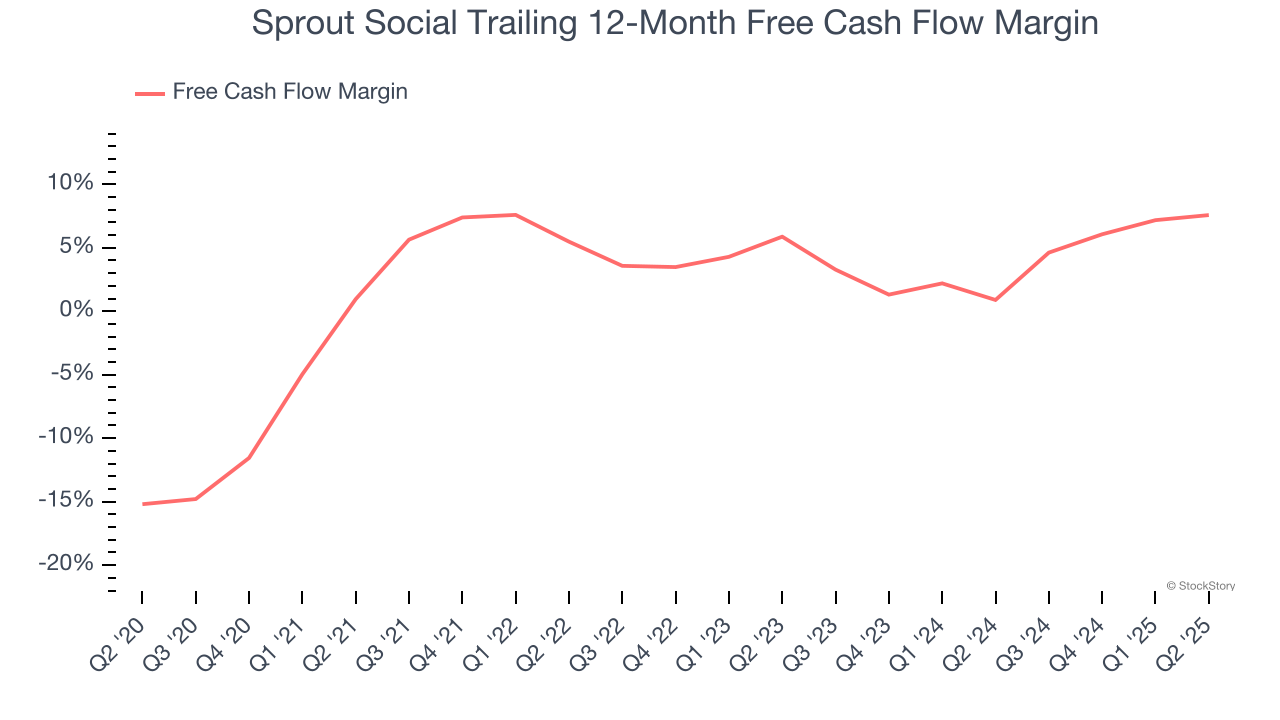
3. Mediocre Free Cash Flow Margin Limits Reinvestment Potential
If you’ve followed StockStory for a while, you know we emphasize free cash flow. Why, you ask? We believe that in the end, cash is king, and you can’t use accounting profits to pay the bills.
Sprout Social has shown weak cash profitability over the last year, giving the company limited opportunities to return capital to shareholders. Its free cash flow margin averaged 7.6%, subpar for a software business.
Final Judgment
Sprout Social’s business quality ultimately falls short of our standards. After the recent drawdown, the stock trades at 1.3× forward price-to-sales (or $10.97 per share). While this valuation is reasonable, we don’t really see a big opportunity at the moment. We're pretty confident there are more exciting stocks to buy at the moment. We’d suggest looking at our favorite semiconductor picks and shovels play.
Stocks We Like More Than Sprout Social
Trump’s April 2025 tariff bombshell triggered a massive market selloff, but stocks have since staged an impressive recovery, leaving those who panic sold on the sidelines.
Take advantage of the rebound by checking out our Top 9 Market-Beating Stocks. This is a curated list of our High Quality stocks that have generated a market-beating return of 183% over the last five years (as of March 31st 2025).
Stocks that made our list in 2020 include now familiar names such as Nvidia (+1,545% between March 2020 and March 2025) as well as under-the-radar businesses like the once-micro-cap company Kadant (+351% five-year return). Find your next big winner with StockStory today.
StockStory is growing and hiring equity analyst and marketing roles. Are you a 0 to 1 builder passionate about the markets and AI? See the open roles here.