
Building envelope solutions provider Carlisle Companies (NYSE: CSL) announced better-than-expected revenue in Q3 CY2025, but sales were flat year on year at $1.35 billion. Its non-GAAP profit of $5.61 per share was 4.8% above analysts’ consensus estimates.
Is now the time to buy Carlisle? Find out by accessing our full research report, it’s free for active Edge members.
Carlisle (CSL) Q3 CY2025 Highlights:
- Revenue: $1.35 billion vs analyst estimates of $1.33 billion (flat year on year, 1.2% beat)
- Adjusted EPS: $5.61 vs analyst estimates of $5.36 (4.8% beat)
- Adjusted EBITDA: $348.7 million vs analyst estimates of $336.8 million (25.9% margin, 3.5% beat)
- Q4 revenue guidance of down low-single-digit percentage (miss vs expectations of slight growth)
- Q4 EBITDA margin guidance of 21% (miss vs expectations of 24%)
- Operating Margin: 21.8%, down from 23.7% in the same quarter last year
- Free Cash Flow Margin: 29.2%, up from 23.2% in the same quarter last year
- Organic Revenue fell 2.1% year on year vs analyst estimates of 3.7% declines (163.8 basis point beat)
- Market Capitalization: $14.52 billion
Company Overview
Originally founded as Carlisle Tire and Rubber Company, Carlisle Companies (NYSE: CSL) is a multi-industry product manufacturer focusing on construction materials and weatherproofing technologies.
Revenue Growth
A company’s long-term performance is an indicator of its overall quality. Any business can have short-term success, but a top-tier one grows for years. Over the last five years, Carlisle grew its sales at a sluggish 3% compounded annual growth rate. This fell short of our benchmark for the industrials sector and is a tough starting point for our analysis.
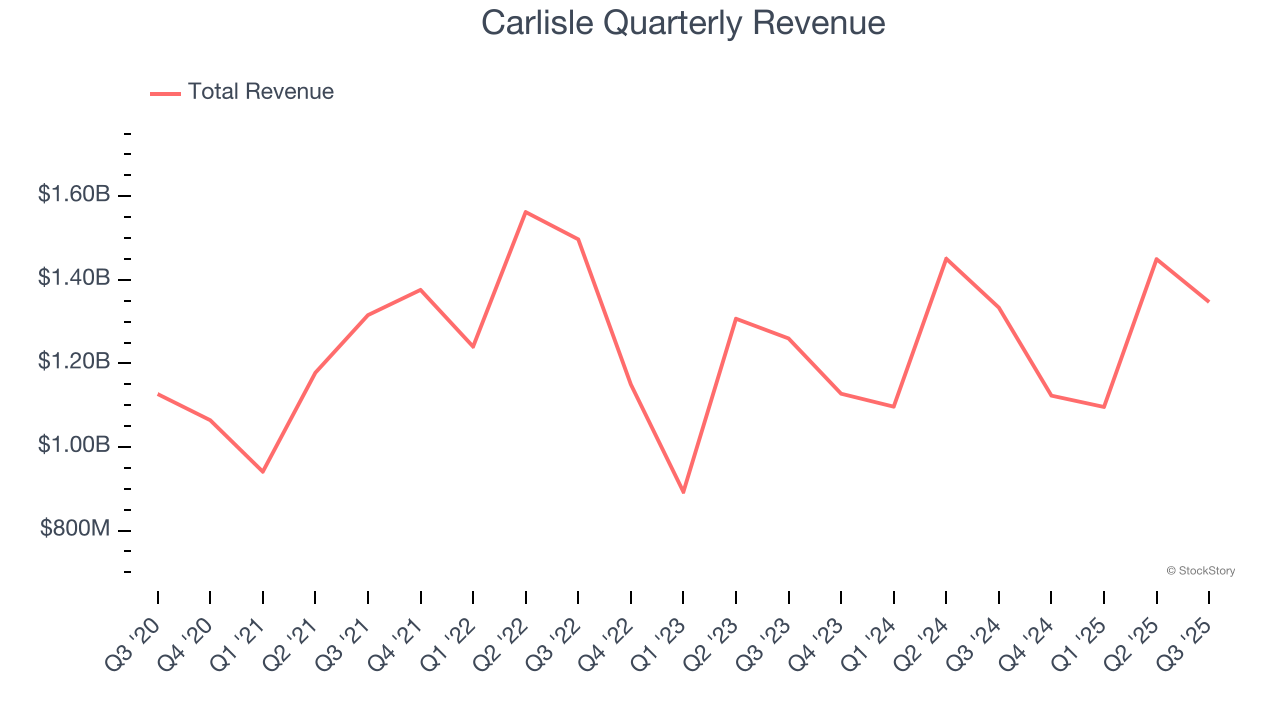
We at StockStory place the most emphasis on long-term growth, but within industrials, a half-decade historical view may miss cycles, industry trends, or a company capitalizing on catalysts such as a new contract win or a successful product line. Carlisle’s annualized revenue growth of 4.3% over the last two years is above its five-year trend, but we were still disappointed by the results. 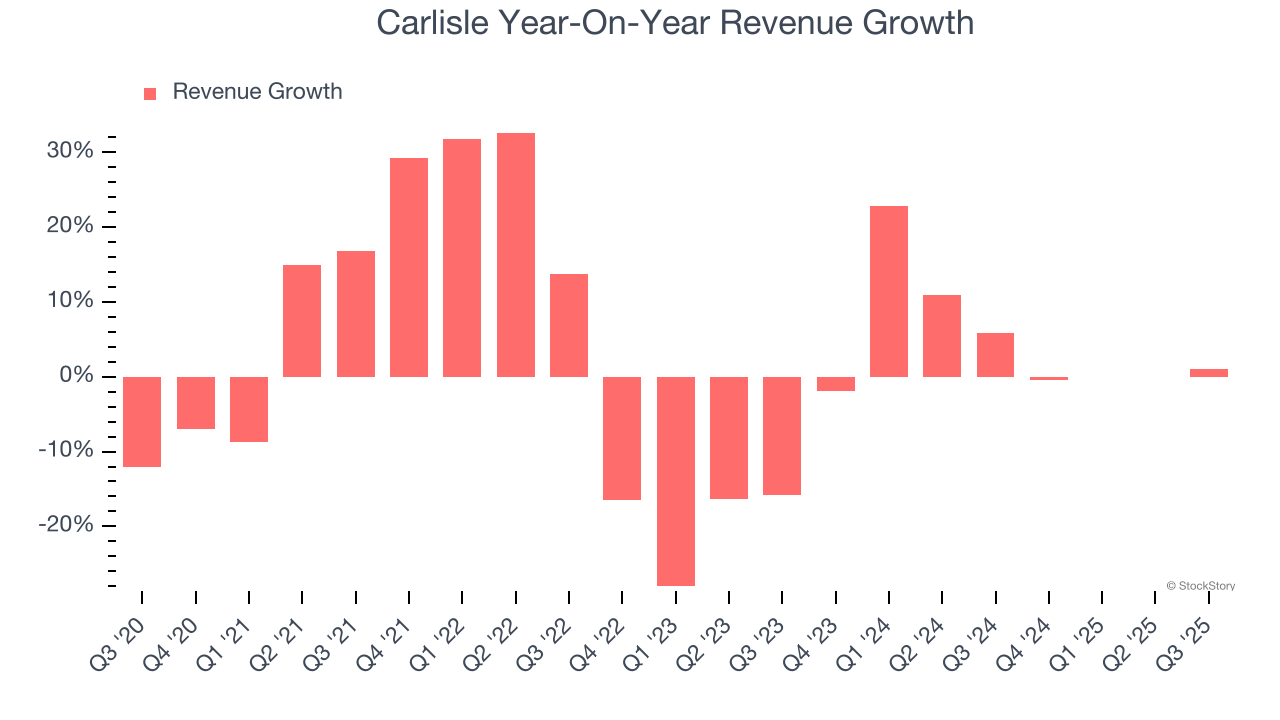
We can dig further into the company’s sales dynamics by analyzing its organic revenue, which strips out one-time events like acquisitions and currency fluctuations that don’t accurately reflect its fundamentals. Over the last two years, Carlisle’s organic revenue averaged 2.4% year-on-year growth. Because this number is lower than its two-year revenue growth, we can see that some mixture of acquisitions and foreign exchange rates boosted its headline results. 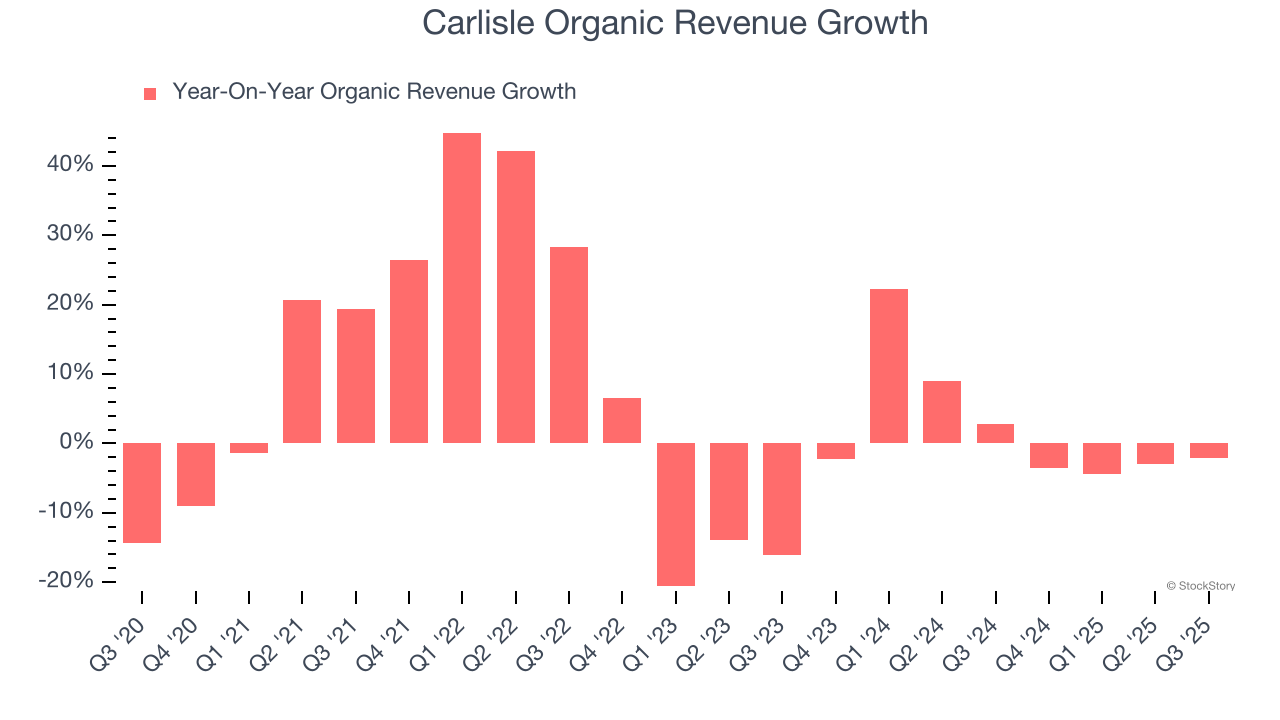
This quarter, Carlisle’s $1.35 billion of revenue was flat year on year but beat Wall Street’s estimates by 1.2%.
Looking ahead, sell-side analysts expect revenue to grow 2.8% over the next 12 months, similar to its two-year rate. This projection is underwhelming and suggests its products and services will see some demand headwinds.
Unless you’ve been living under a rock, it should be obvious by now that generative AI is going to have a huge impact on how large corporations do business. While Nvidia and AMD are trading close to all-time highs, we prefer a lesser-known (but still profitable) stock benefiting from the rise of AI. Click here to access our free report one of our favorites growth stories.
Operating Margin
Operating margin is a key measure of profitability. Think of it as net income - the bottom line - excluding the impact of taxes and interest on debt, which are less connected to business fundamentals.
Carlisle has been a well-oiled machine over the last five years. It demonstrated elite profitability for an industrials business, boasting an average operating margin of 19.5%. This result isn’t too surprising as its gross margin gives it a favorable starting point.
Analyzing the trend in its profitability, Carlisle’s operating margin rose by 9.6 percentage points over the last five years, as its sales growth gave it operating leverage.
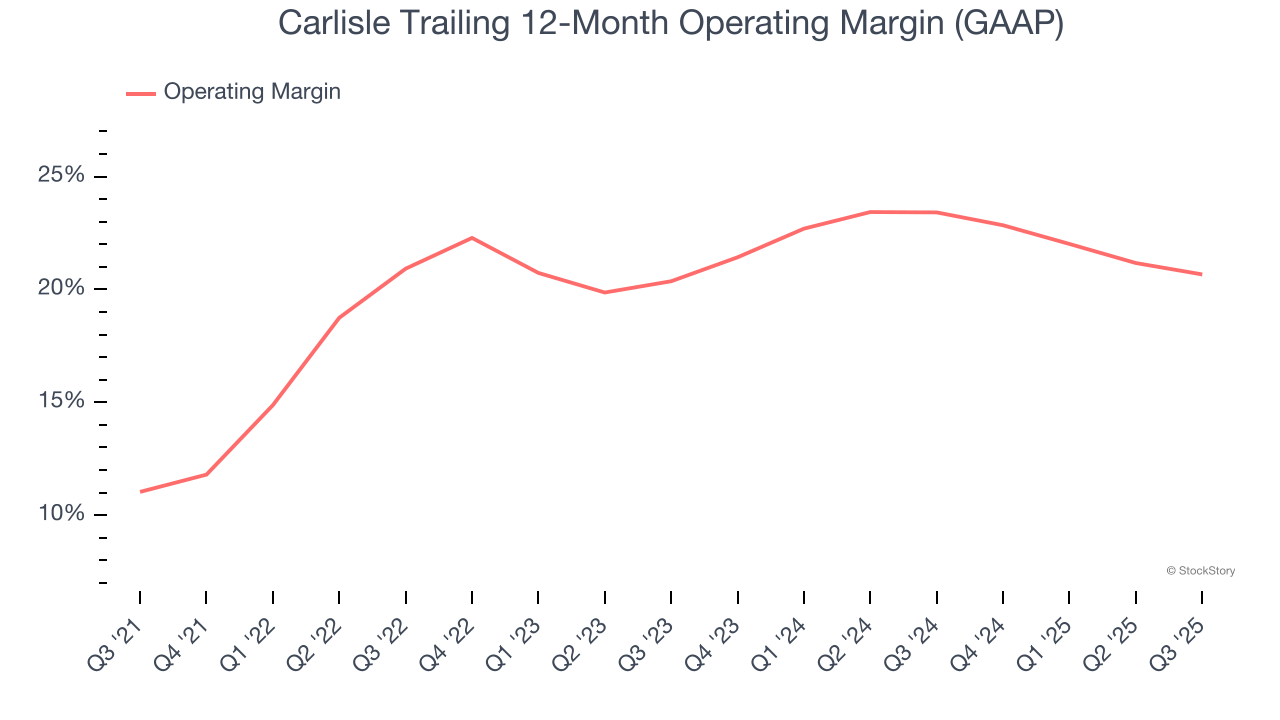
This quarter, Carlisle generated an operating margin profit margin of 21.8%, down 1.9 percentage points year on year. Since Carlisle’s gross margin decreased more than its operating margin, we can assume its recent inefficiencies were driven more by weaker leverage on its cost of sales rather than increased marketing, R&D, and administrative overhead expenses.
Earnings Per Share
Revenue trends explain a company’s historical growth, but the long-term change in earnings per share (EPS) points to the profitability of that growth – for example, a company could inflate its sales through excessive spending on advertising and promotions.
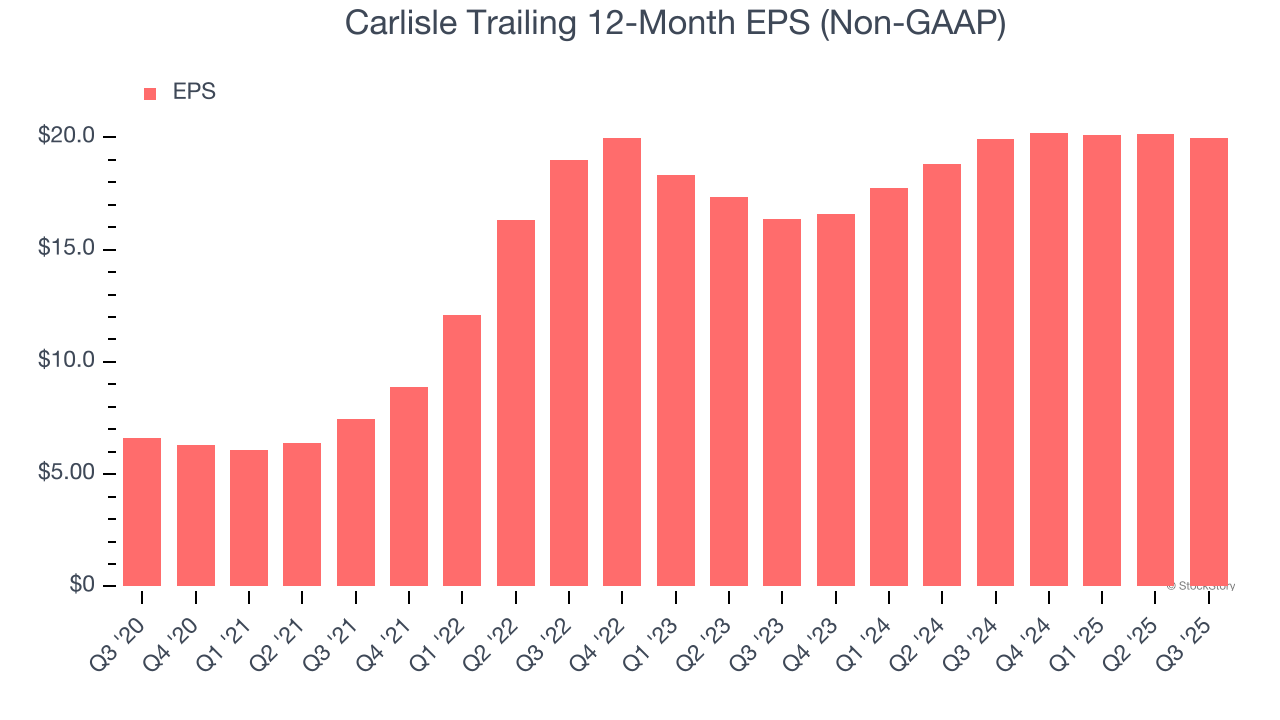
Carlisle’s EPS grew at an astounding 24.7% compounded annual growth rate over the last five years, higher than its 3% annualized revenue growth. This tells us the company became more profitable on a per-share basis as it expanded.
We can take a deeper look into Carlisle’s earnings quality to better understand the drivers of its performance. As we mentioned earlier, Carlisle’s operating margin declined this quarter but expanded by 9.6 percentage points over the last five years. Its share count also shrank by 21.3%, and these factors together are positive signs for shareholders because improving profitability and share buybacks turbocharge EPS growth relative to revenue growth. 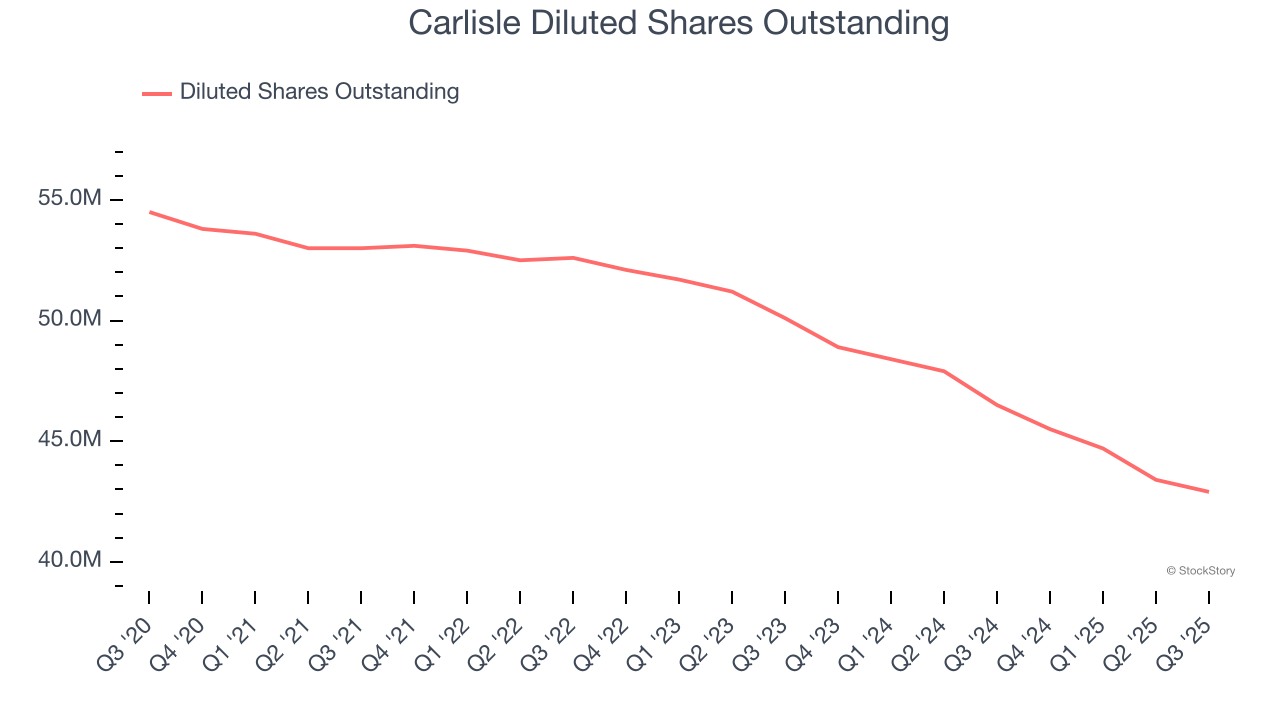
Like with revenue, we analyze EPS over a more recent period because it can provide insight into an emerging theme or development for the business.
For Carlisle, its two-year annual EPS growth of 10.5% was lower than its five-year trend. We still think its growth was good and hope it can accelerate in the future.
In Q3, Carlisle reported adjusted EPS of $5.61, down from $5.78 in the same quarter last year. Despite falling year on year, this print beat analysts’ estimates by 4.8%. Over the next 12 months, Wall Street expects Carlisle’s full-year EPS of $19.96 to grow 5.8%.
Key Takeaways from Carlisle’s Q3 Results
We enjoyed seeing Carlisle beat analysts’ organic revenue expectations this quarter. We were also happy its EPS outperformed Wall Street’s estimates. On the other hand, Q4 guidance came in below expectations for both revenue growth and EBITDA margin. This is weighing on shares, and the stock traded down 1.7% to $324.84 immediately after reporting.
So should you invest in Carlisle right now? If you’re making that decision, you should consider the bigger picture of valuation, business qualities, as well as the latest earnings. We cover that in our actionable full research report which you can read here, it’s free for active Edge members.


