
Hospitality and casino entertainment company MGM Resorts (NYSE: MGM) met Wall Street’s revenue expectations in Q3 CY2025, with sales up 1.6% year on year to $4.25 billion. Its non-GAAP profit of $0.24 per share was 19.9% below analysts’ consensus estimates.
Is now the time to buy MGM Resorts? Find out by accessing our full research report, it’s free for active Edge members.
MGM Resorts (MGM) Q3 CY2025 Highlights:
- Revenue: $4.25 billion vs analyst estimates of $4.24 billion (1.6% year-on-year growth, in line)
- Adjusted EPS: $0.24 vs analyst expectations of $0.30 (19.9% miss)
- Adjusted EBITDA: $505.8 million vs analyst estimates of $1.1 billion (11.9% margin, 53.8% miss)
- Operating Margin: -2.7%, down from 7.5% in the same quarter last year
- Market Capitalization: $8.5 billion
"MGM Resorts delivered another quarter of consolidated net revenue growth as we benefit from our operational scale and diversity, highlighted by record third quarter results from MGM China," said Bill Hornbuckle, Chief Executive Officer & President of MGM Resorts International.
Company Overview
Operating several properties on the Las Vegas Strip, MGM Resorts (NYSE: MGM) is a global hospitality and entertainment company known for its resorts and casinos.
Revenue Growth
A company’s long-term performance is an indicator of its overall quality. Any business can put up a good quarter or two, but the best consistently grow over the long haul. Luckily, MGM Resorts’s sales grew at a solid 20.3% compounded annual growth rate over the last five years. Its growth beat the average consumer discretionary company and shows its offerings resonate with customers.
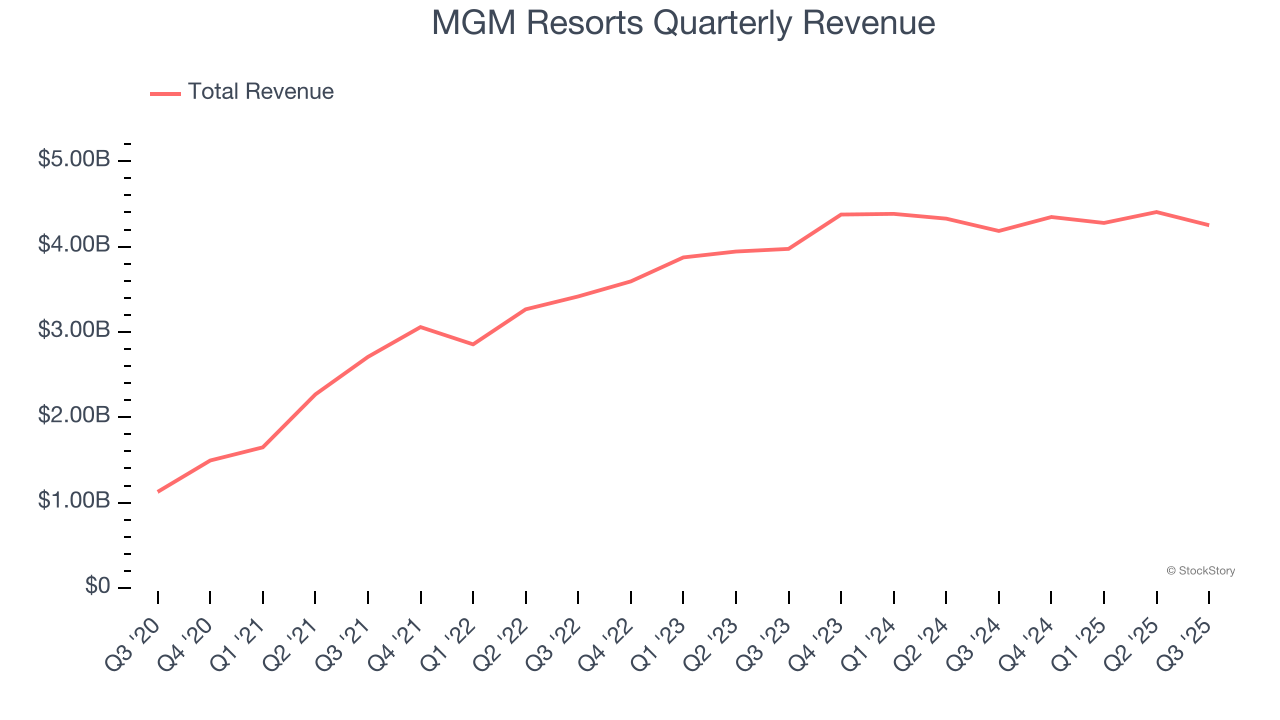
We at StockStory place the most emphasis on long-term growth, but within consumer discretionary, a stretched historical view may miss a company riding a successful new product or trend. MGM Resorts’s recent performance shows its demand has slowed as its annualized revenue growth of 6% over the last two years was below its five-year trend. Note that COVID hurt MGM Resorts’s business in 2020 and part of 2021, and it bounced back in a big way thereafter. 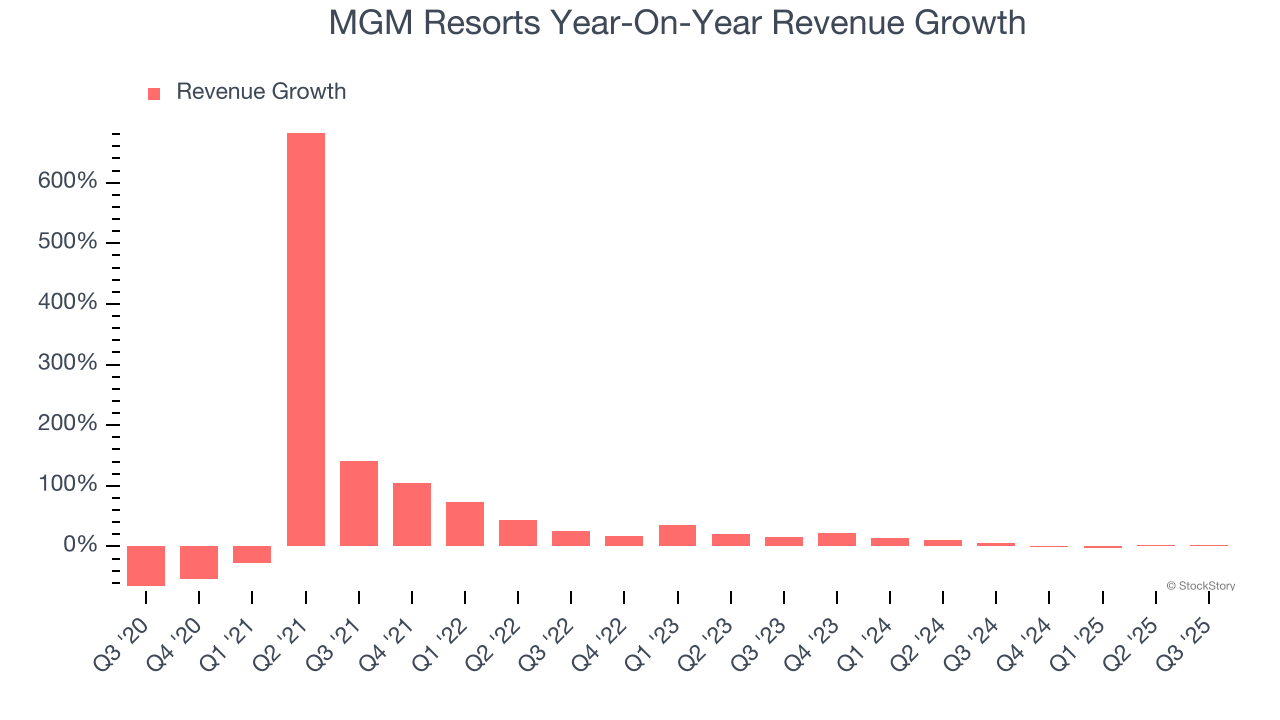
We can dig further into the company’s revenue dynamics by analyzing its three most important segments: Casino, Hotel, and Dining, which are 54%, 18.7%, and 17.6% of revenue. Over the last two years, MGM Resorts’s revenues in all three segments increased. Its Casino revenue (Poker, sports betting) averaged year-on-year growth of 11.6% while its Hotel (overnight bookings) and Dining (food and beverage) revenues averaged 1.5% and 3.1%. 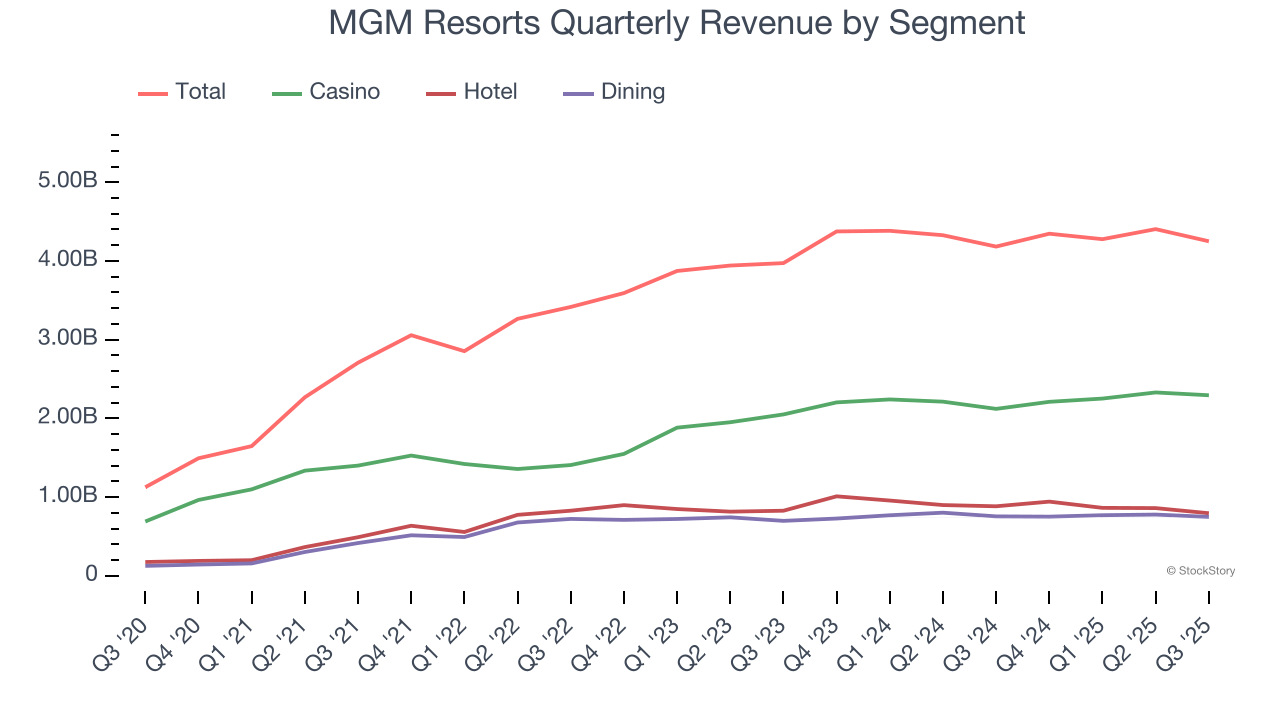
This quarter, MGM Resorts grew its revenue by 1.6% year on year, and its $4.25 billion of revenue was in line with Wall Street’s estimates.
Looking ahead, sell-side analysts expect revenue to remain flat over the next 12 months, a deceleration versus the last two years. This projection is underwhelming and indicates its products and services will see some demand headwinds.
Here at StockStory, we certainly understand the potential of thematic investing. Diverse winners from Microsoft (MSFT) to Alphabet (GOOG), Coca-Cola (KO) to Monster Beverage (MNST) could all have been identified as promising growth stories with a megatrend driving the growth. So, in that spirit, we’ve identified a relatively under-the-radar profitable growth stock benefiting from the rise of AI, available to you FREE via this link.
Operating Margin
MGM Resorts’s operating margin has been trending down over the last 12 months and averaged 7.5% over the last two years. Although this result isn’t good, the company’s solid historical revenue growth suggests it ramped up investments to capture market share. We’ll keep a close eye to see if this strategy pays off.
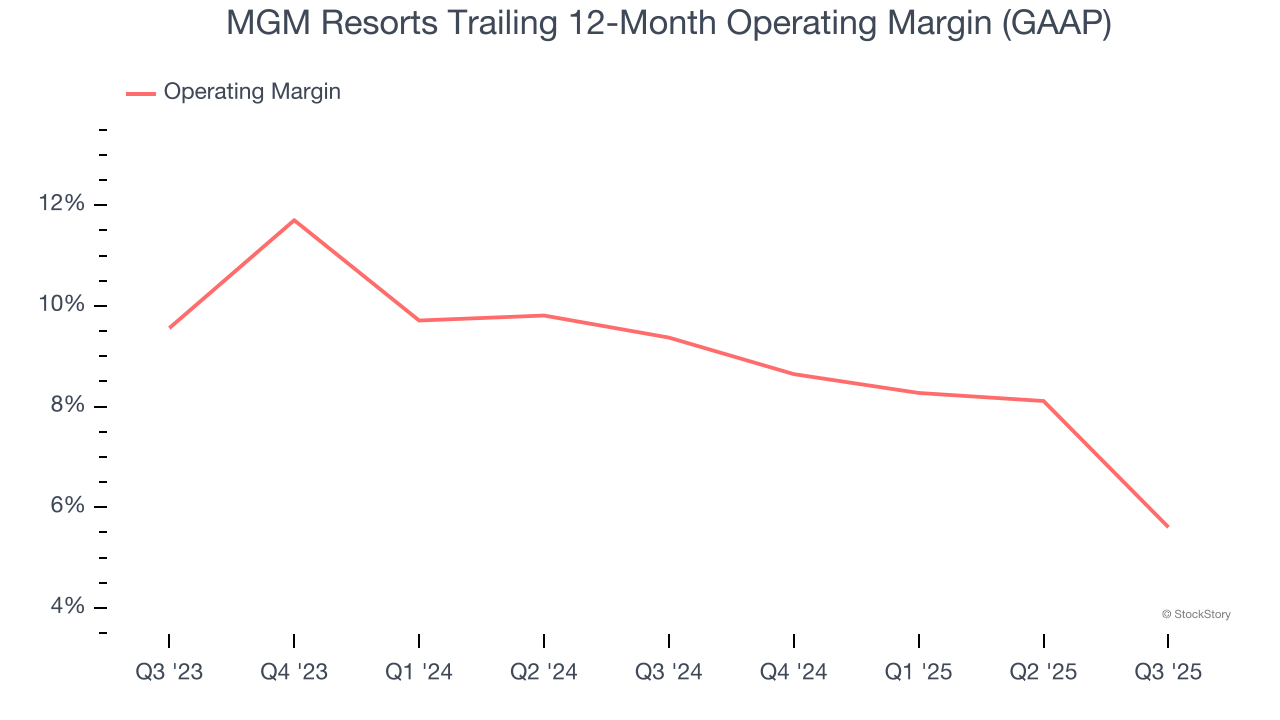
In Q3, MGM Resorts generated an operating margin profit margin of negative 2.7%, down 10.2 percentage points year on year. This contraction shows it was less efficient because its expenses grew faster than its revenue.
Earnings Per Share
Revenue trends explain a company’s historical growth, but the long-term change in earnings per share (EPS) points to the profitability of that growth – for example, a company could inflate its sales through excessive spending on advertising and promotions.
MGM Resorts’s full-year EPS flipped from negative to positive over the last five years. This is encouraging and shows it’s at a critical moment in its life.
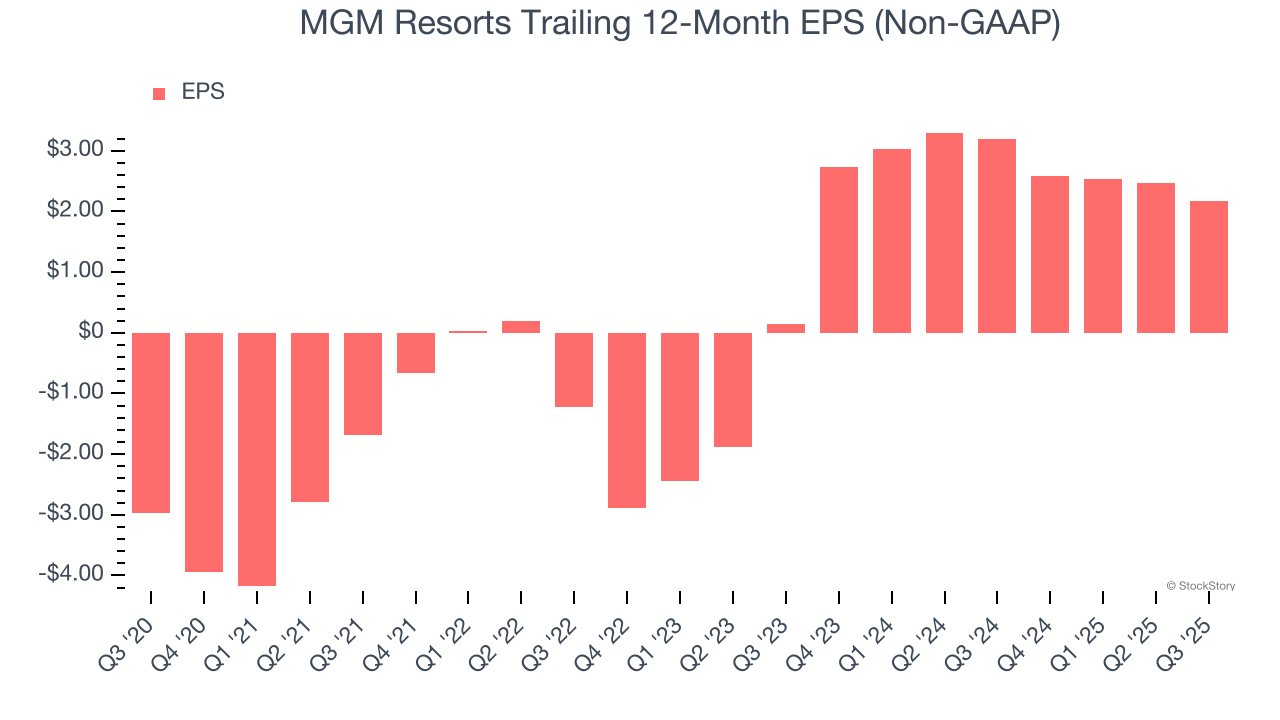
In Q3, MGM Resorts reported adjusted EPS of $0.24, down from $0.54 in the same quarter last year. This print missed analysts’ estimates, but we care more about long-term adjusted EPS growth than short-term movements. Over the next 12 months, Wall Street expects MGM Resorts’s full-year EPS of $2.17 to grow 11.7%.
Key Takeaways from MGM Resorts’s Q3 Results
On the other hand, its and its EBITDA fell short of Wall Street’s estimates. Overall, this was a softer quarter. The stock traded down 2.6% to $30.40 immediately after reporting.
MGM Resorts’s earnings report left more to be desired. Let’s look forward to see if this quarter has created an opportunity to buy the stock. When making that decision, it’s important to consider its valuation, business qualities, as well as what has happened in the latest quarter. We cover that in our actionable full research report which you can read here, it’s free for active Edge members.


