Auto services provider Monro (NASDAQ: MNRO) missed Wall Street’s revenue expectations in Q3 CY2025, with sales falling 4.1% year on year to $288.9 million. Its non-GAAP profit of $0.21 per share was 16.7% above analysts’ consensus estimates.
Is now the time to buy Monro? Find out by accessing our full research report, it’s free for active Edge members.
Monro (MNRO) Q3 CY2025 Highlights:
- Revenue: $288.9 million vs analyst estimates of $297.4 million (4.1% year-on-year decline, 2.8% miss)
- Adjusted EPS: $0.21 vs analyst estimates of $0.18 (16.7% beat)
- Operating Margin: 4.4%, in line with the same quarter last year
- Locations: 1,116 at quarter end, down from 1,272 in the same quarter last year
- Same-Store Sales rose 1.1% year on year (-5.8% in the same quarter last year)
- Market Capitalization: $542 million
Company Overview
Started as a single location in Rochester, New York, Monro (NASDAQ: MNRO) provides common auto services such as brake repairs, tire replacements, and oil changes.
Revenue Growth
Reviewing a company’s long-term sales performance reveals insights into its quality. Even a bad business can shine for one or two quarters, but a top-tier one grows for years.
With $1.19 billion in revenue over the past 12 months, Monro is a small retailer, which sometimes brings disadvantages compared to larger competitors benefiting from economies of scale and negotiating leverage with suppliers.
As you can see below, Monro struggled to increase demand as its $1.19 billion of sales for the trailing 12 months was close to its revenue six years ago (we compare to 2019 to normalize for COVID-19 impacts). This was mainly because it closed stores and observed lower sales at existing, established locations.
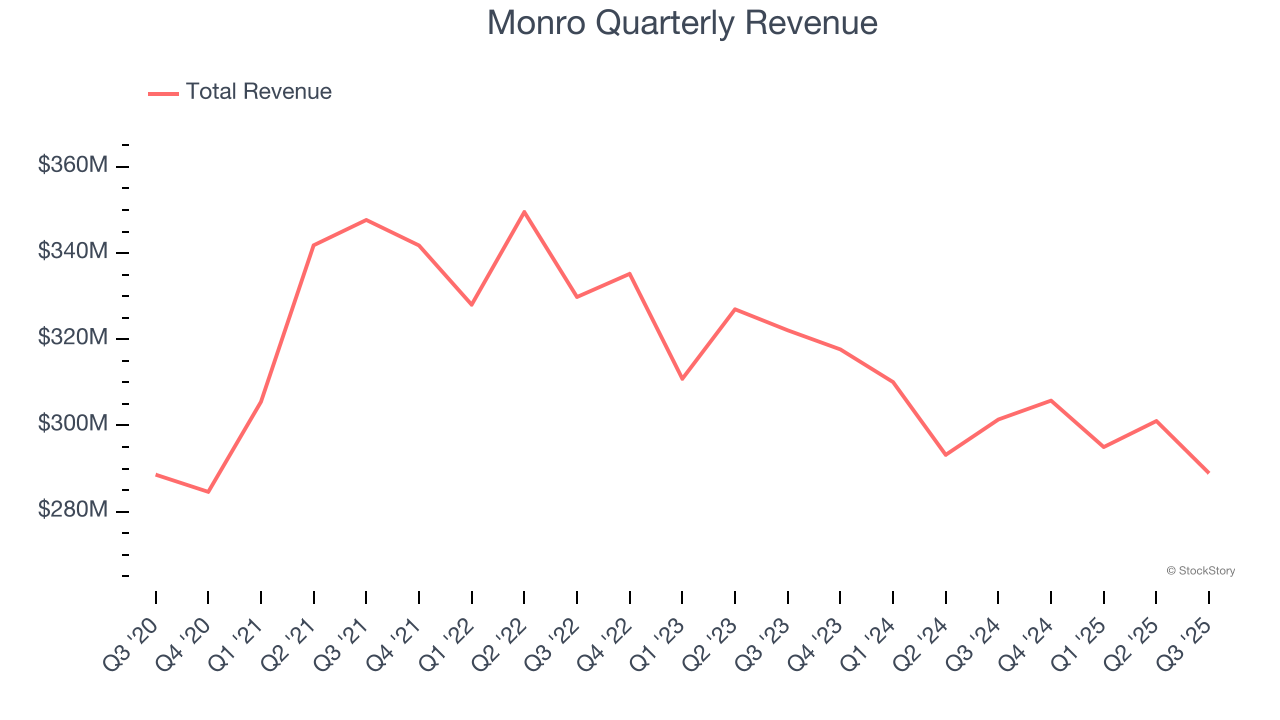
This quarter, Monro missed Wall Street’s estimates and reported a rather uninspiring 4.1% year-on-year revenue decline, generating $288.9 million of revenue.
Looking ahead, sell-side analysts expect revenue to grow 1.3% over the next 12 months. Although this projection implies its newer products will catalyze better top-line performance, it is still below the sector average.
Here at StockStory, we certainly understand the potential of thematic investing. Diverse winners from Microsoft (MSFT) to Alphabet (GOOG), Coca-Cola (KO) to Monster Beverage (MNST) could all have been identified as promising growth stories with a megatrend driving the growth. So, in that spirit, we’ve identified a relatively under-the-radar profitable growth stock benefiting from the rise of AI, available to you FREE via this link.
Store Performance
Number of Stores
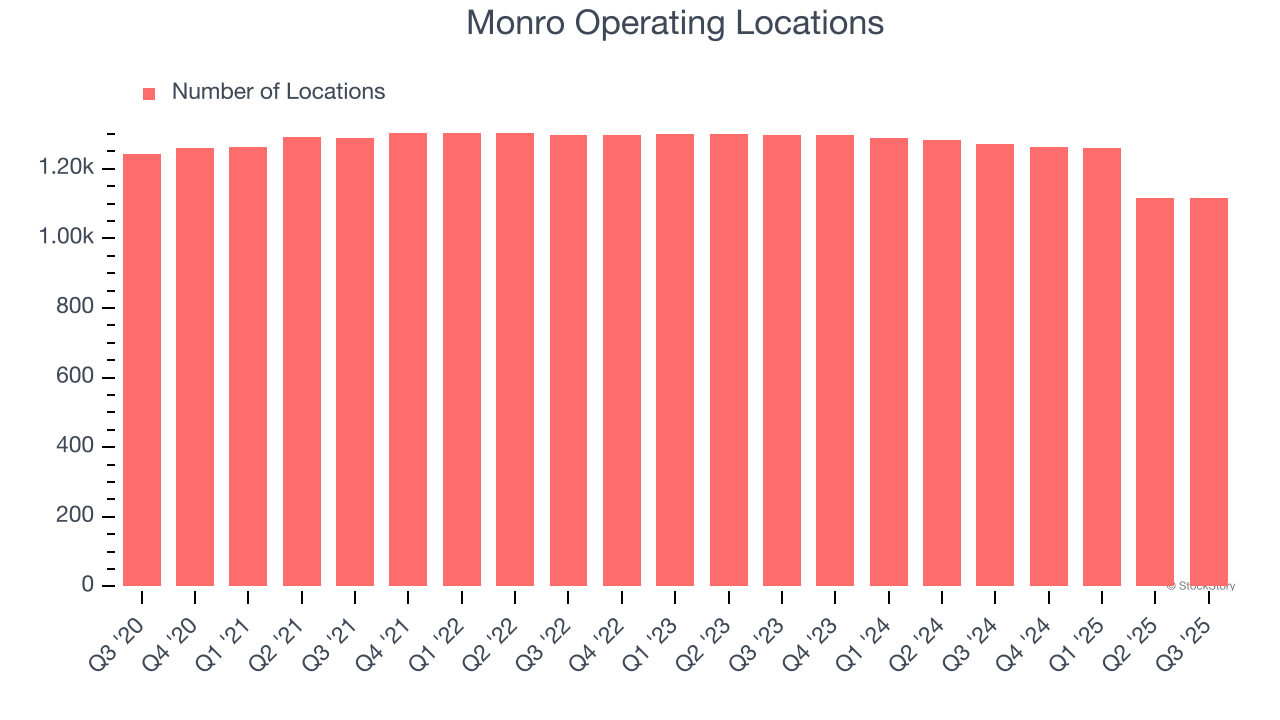
A retailer’s store count often determines how much revenue it can generate.
Monro listed 1,116 locations in the latest quarter and has generally closed its stores over the last two years, averaging 4.3% annual declines.
When a retailer shutters stores, it usually means that brick-and-mortar demand is less than supply, and it is responding by closing underperforming locations to improve profitability.
Same-Store Sales
The change in a company's store base only tells one side of the story. The other is the performance of its existing locations and e-commerce sales, which informs management teams whether they should expand or downsize their physical footprints. Same-store sales is an industry measure of whether revenue is growing at those existing stores and is driven by customer visits (often called traffic) and the average spending per customer (ticket).
Monro’s demand has been shrinking over the last two years as its same-store sales have averaged 2.2% annual declines. This performance isn’t ideal, and Monro is attempting to boost same-store sales by closing stores (fewer locations sometimes lead to higher same-store sales).
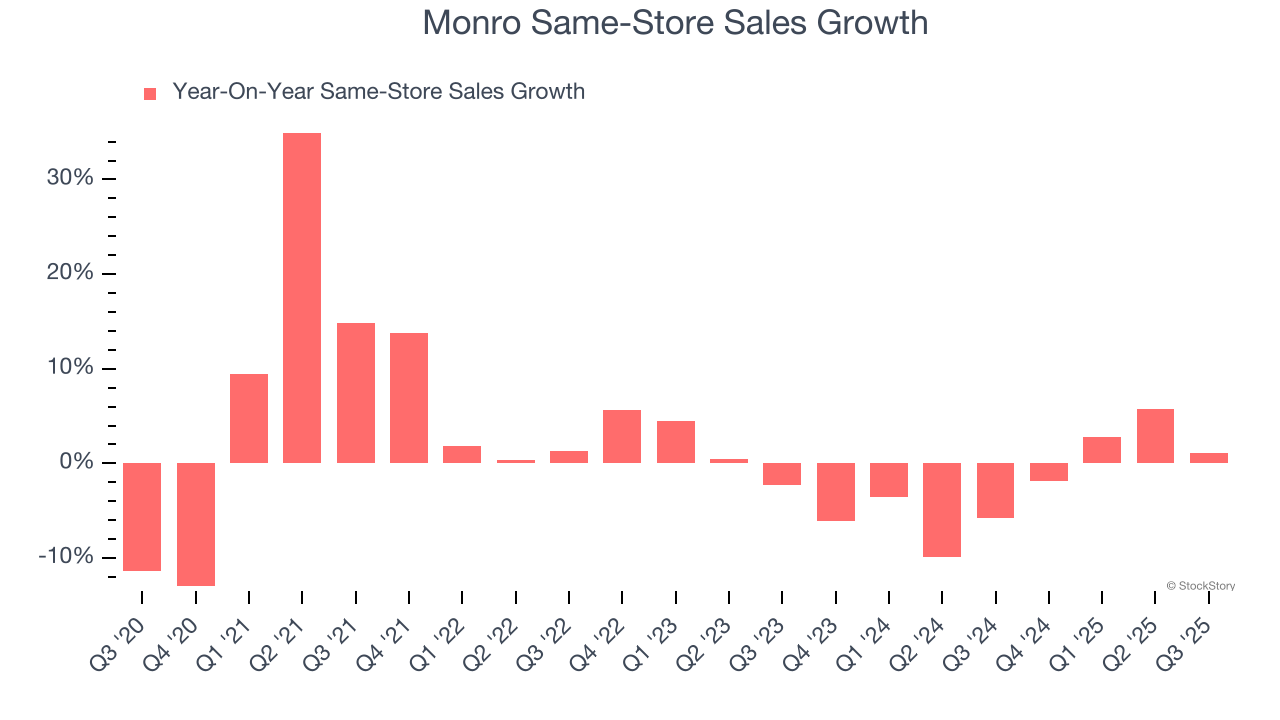
In the latest quarter, Monro’s same-store sales rose 1.1% year on year. This growth was a well-appreciated turnaround from its historical levels, showing the business is regaining momentum.
Key Takeaways from Monro’s Q3 Results
It was good to see Monro beat analysts’ EPS expectations this quarter. We were also happy its gross margin outperformed Wall Street’s estimates. On the other hand, its revenue missed. Overall, this quarter could have been better. The stock remained flat at $18.10 immediately following the results.
Big picture, is Monro a buy here and now? We think that the latest quarter is only one piece of the longer-term business quality puzzle. Quality, when combined with valuation, can help determine if the stock is a buy. We cover that in our actionable full research report which you can read here, it’s free for active Edge members.


