
Industrial components supplier NN (NASDAQ: NNBR) missed Wall Street’s revenue expectations in Q3 CY2025, with sales falling 8.5% year on year to $103.9 million. The company’s full-year revenue guidance of $430 million at the midpoint came in 1% below analysts’ estimates. Its non-GAAP loss of $0.01 per share was $0.03 below analysts’ consensus estimates.
Is now the time to buy NN? Find out by accessing our full research report, it’s free for active Edge members.
NN (NNBR) Q3 CY2025 Highlights:
- Revenue: $103.9 million vs analyst estimates of $111.8 million (8.5% year-on-year decline, 7.1% miss)
- Adjusted EPS: -$0.01 vs analyst estimates of $0.02 ($0.03 miss)
- Adjusted EBITDA: $12.37 million vs analyst estimates of $13.83 million (11.9% margin, 10.6% miss)
- The company dropped its revenue guidance for the full year to $430 million at the midpoint from $445 million, a 3.4% decrease
- EBITDA guidance for the full year is $58 million at the midpoint, above analyst estimates of $53.04 million
- Operating Margin: -2.2%, up from -3.3% in the same quarter last year
- Free Cash Flow was $7.70 million, up from -$1.34 million in the same quarter last year
- Market Capitalization: $94.56 million
Harold Bevis, President and Chief Executive Officer, said, “NN maintained its advancement program during the quarter, balanced around growth in targeted areas, rationalization of underperforming business, cost optimization, and cash management. We delivered another quarter of strong progress, as our transformation plan generated measurable improvement to our business fundamentals, while driving higher operating income, improved gross and adjusted EBITDA margins, and positive free cash flow performance. While certain global automotive markets remain soft in base volumes along with some new program pushouts, we are seeing better forward forecasts and tangible benefits from prior program wins, which are helping to counterbalance persistent macro pressures.”
Company Overview
Formerly known as Nuturn, NN (NASDAQ: NNBR) provides metal components, bearings, and plastic and rubber components to the automotive, aerospace, medical, and industrial sectors.
Revenue Growth
Examining a company’s long-term performance can provide clues about its quality. Any business can put up a good quarter or two, but the best consistently grow over the long haul. Unfortunately, NN struggled to consistently increase demand as its $424 million of sales for the trailing 12 months was close to its revenue five years ago. This was below our standards and is a sign of poor business quality.
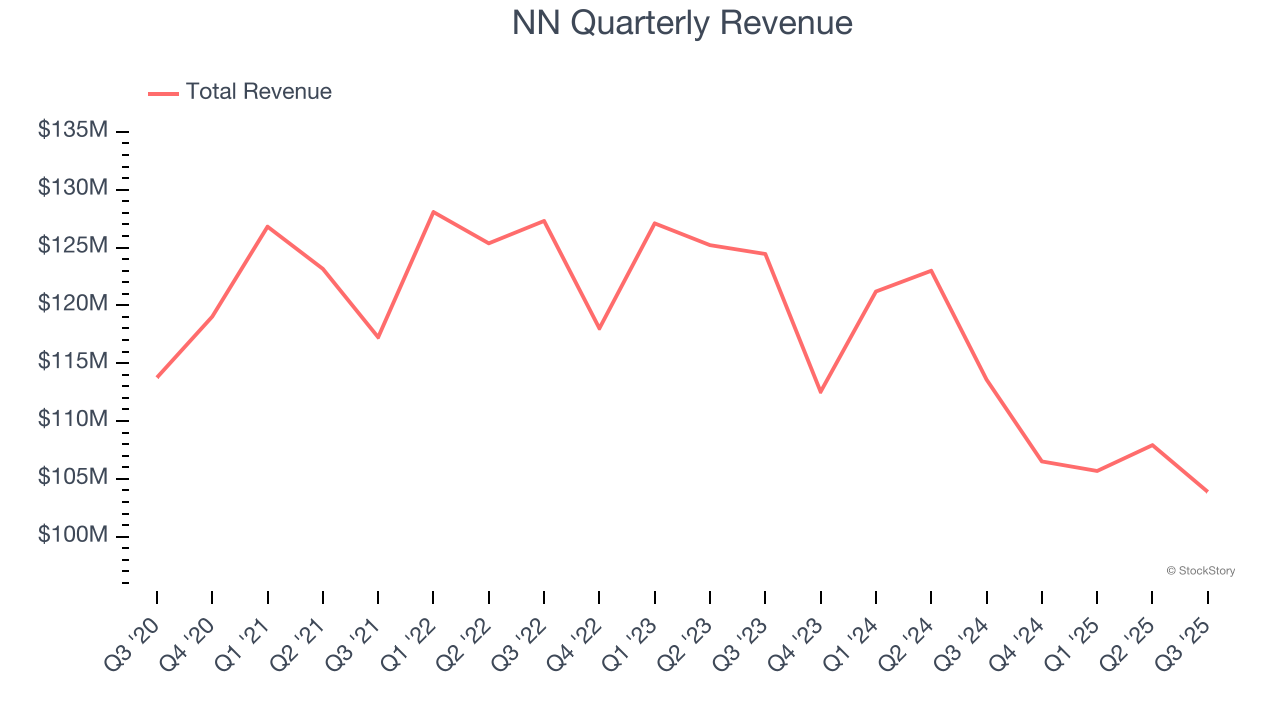
We at StockStory place the most emphasis on long-term growth, but within industrials, a half-decade historical view may miss cycles, industry trends, or a company capitalizing on catalysts such as a new contract win or a successful product line. NN’s recent performance shows its demand remained suppressed as its revenue has declined by 7.4% annually over the last two years. 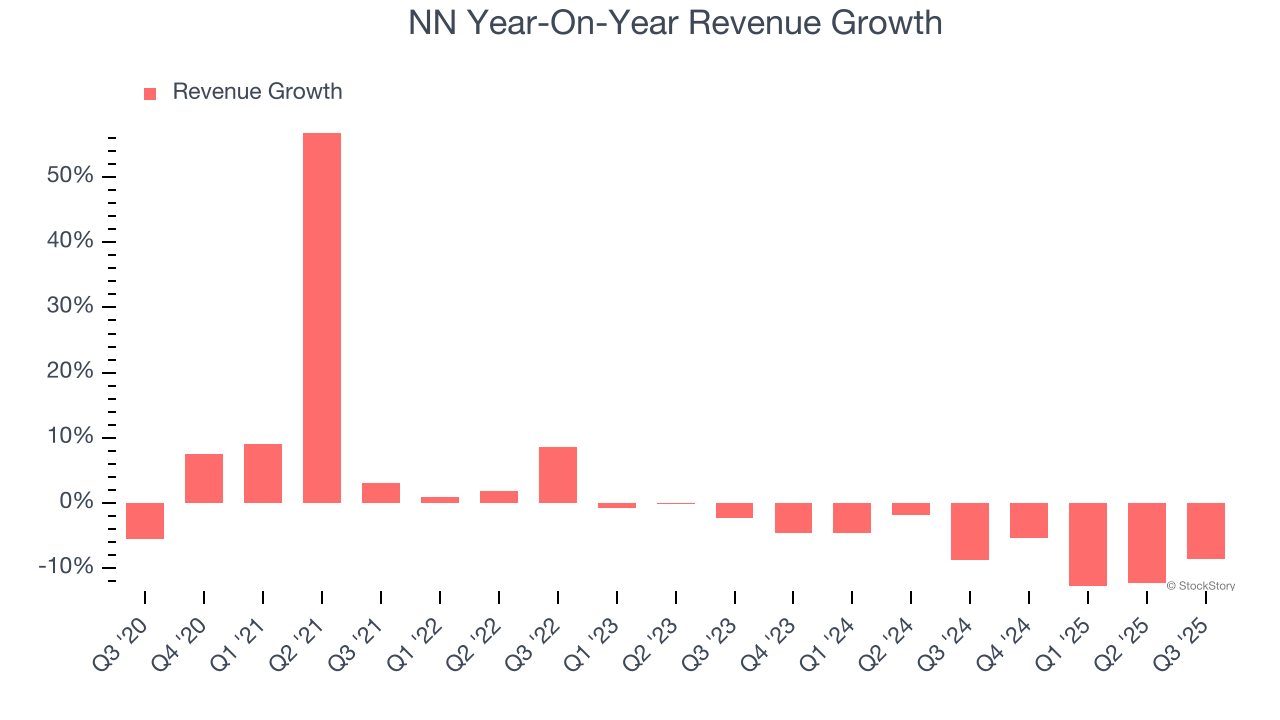
This quarter, NN missed Wall Street’s estimates and reported a rather uninspiring 8.5% year-on-year revenue decline, generating $103.9 million of revenue.
Looking ahead, sell-side analysts expect revenue to grow 4.8% over the next 12 months. Although this projection implies its newer products and services will fuel better top-line performance, it is still below the sector average.
Today’s young investors won’t have read the timeless lessons in Gorilla Game: Picking Winners In High Technology because it was written more than 20 years ago when Microsoft and Apple were first establishing their supremacy. But if we apply the same principles, then enterprise software stocks leveraging their own generative AI capabilities may well be the Gorillas of the future. So, in that spirit, we are excited to present our Special Free Report on a profitable, fast-growing enterprise software stock that is already riding the automation wave and looking to catch the generative AI next.
Operating Margin
NN’s high expenses have contributed to an average operating margin of negative 3.4% over the last five years. Unprofitable industrials companies require extra attention because they could get caught swimming naked when the tide goes out. It’s hard to trust that the business can endure a full cycle.
Looking at the trend in its profitability, NN’s operating margin decreased by 4.3 percentage points over the last five years. NN’s performance was poor no matter how you look at it - it shows that costs were rising and it couldn’t pass them onto its customers.
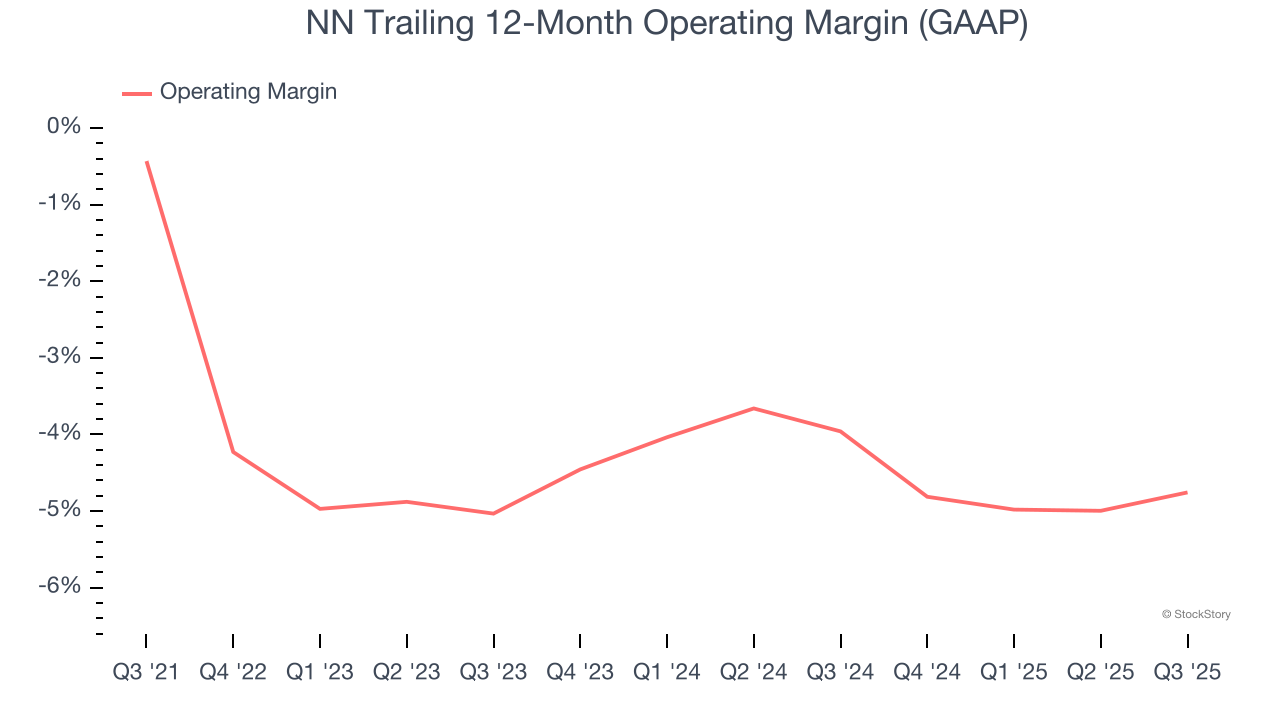
In Q3, NN generated a negative 2.2% operating margin. The company's consistent lack of profits raise a flag.
Earnings Per Share
Revenue trends explain a company’s historical growth, but the long-term change in earnings per share (EPS) points to the profitability of that growth – for example, a company could inflate its sales through excessive spending on advertising and promotions.
Sadly for NN, its EPS declined by 18.8% annually over the last five years while its revenue was flat. This tells us the company struggled because its fixed cost base made it difficult to adjust to choppy demand.
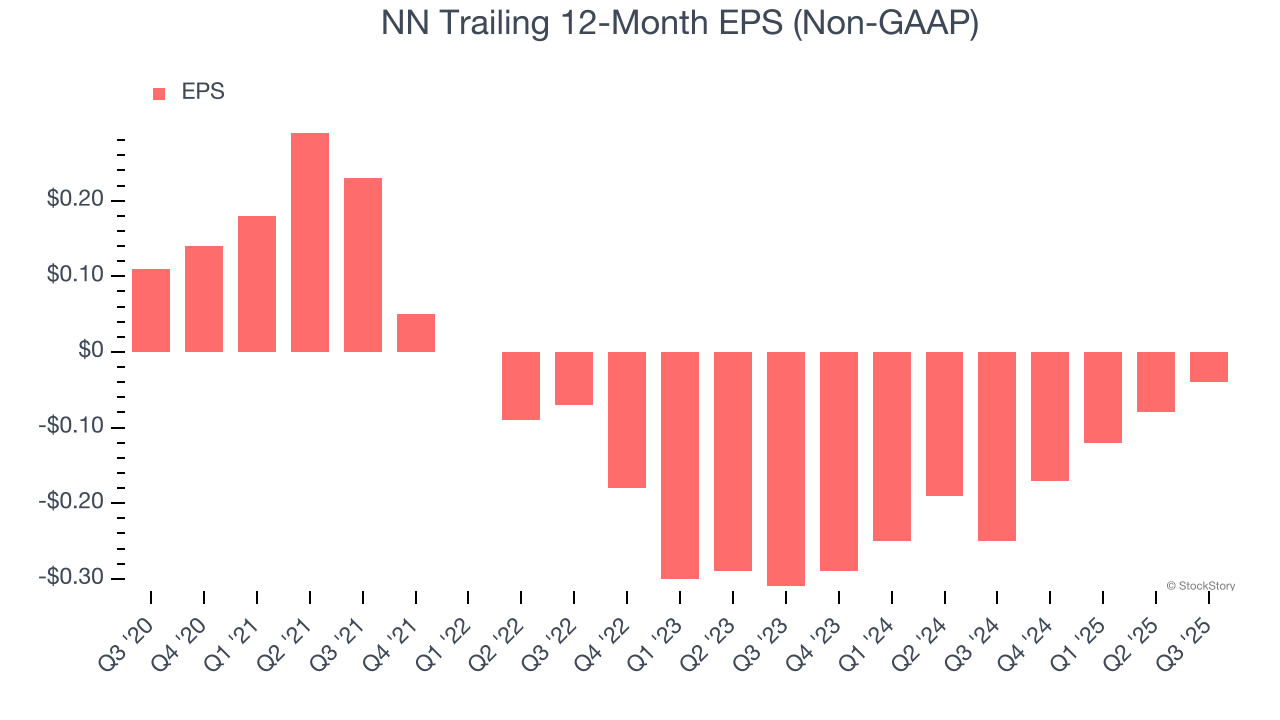
We can take a deeper look into NN’s earnings to better understand the drivers of its performance. As we mentioned earlier, NN’s operating margin expanded this quarter but declined by 4.3 percentage points over the last five years. Its share count also grew by 17.5%, meaning the company not only became less efficient with its operating expenses but also diluted its shareholders. 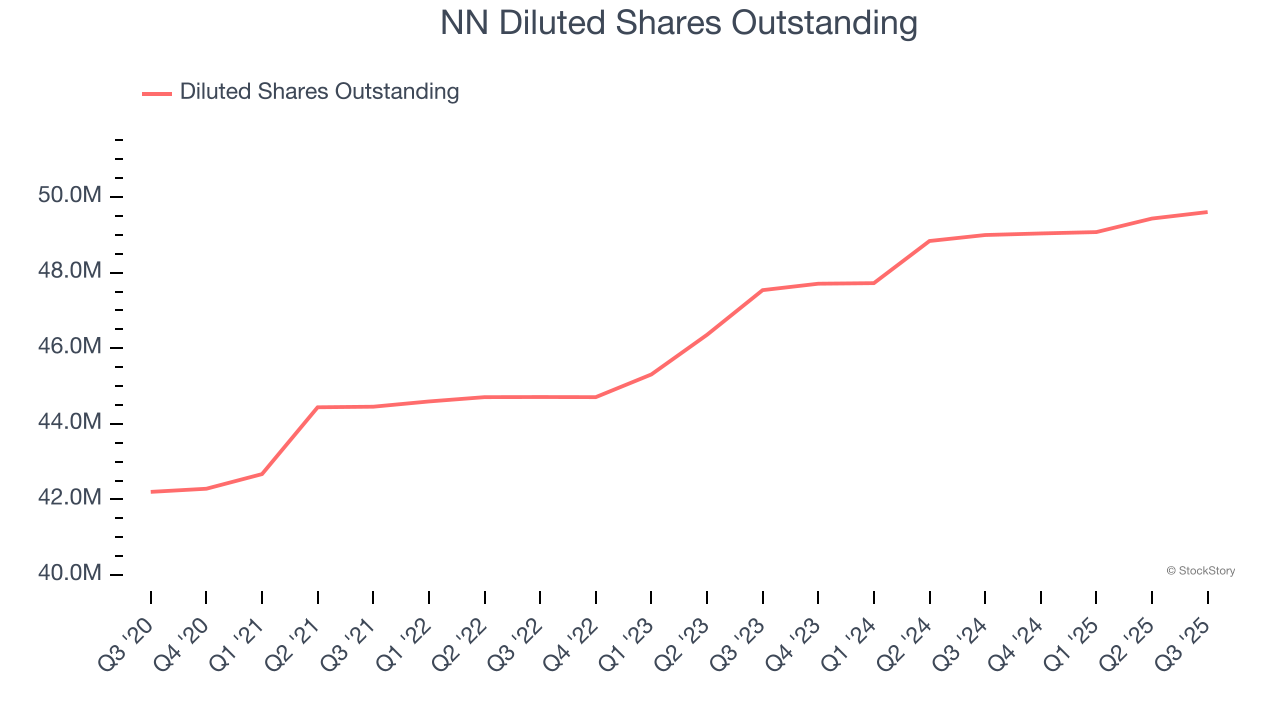
Like with revenue, we analyze EPS over a more recent period because it can provide insight into an emerging theme or development for the business.
For NN, its two-year annual EPS growth of 64.1% was higher than its five-year trend. Its improving earnings is an encouraging data point, but a caveat is that its EPS is still in the red.
In Q3, NN reported adjusted EPS of negative $0.01, up from negative $0.05 in the same quarter last year. Despite growing year on year, this print missed analysts’ estimates. Over the next 12 months, Wall Street is optimistic. Analysts forecast NN’s full-year EPS of negative $0.04 will flip to positive $0.08.
Key Takeaways from NN’s Q3 Results
We were impressed by NN’s optimistic full-year EBITDA guidance, which blew past analysts’ expectations. On the other hand, its revenue missed and its EBITDA fell short of Wall Street’s estimates. Overall, this was a softer quarter. The stock traded down 10.1% to $1.70 immediately following the results.
NN may have had a tough quarter, but does that actually create an opportunity to invest right now? What happened in the latest quarter matters, but not as much as longer-term business quality and valuation, when deciding whether to invest in this stock. We cover that in our actionable full research report which you can read here, it’s free for active Edge members.


