
Shipping and mailing solutions provider Pitney Bowes (NYSE: PBI) missed Wall Street’s revenue expectations in Q3 CY2025, with sales falling 8% year on year to $459.7 million. On the other hand, the company’s outlook for the full year was close to analysts’ estimates with revenue guided to $1.93 billion at the midpoint. Its non-GAAP profit of $0.31 per share was in line with analysts’ consensus estimates.
Is now the time to buy Pitney Bowes? Find out by accessing our full research report, it’s free for active Edge members.
Pitney Bowes (PBI) Q3 CY2025 Highlights:
- Revenue: $459.7 million vs analyst estimates of $467.4 million (8% year-on-year decline, 1.7% miss)
- Adjusted EPS: $0.31 vs analyst estimates of $0.32 (in line)
- Adjusted EBITDA: $134.8 million (29.3% margin, 81.7% year-on-year growth)
- The company reconfirmed its revenue guidance for the full year of $1.93 billion at the midpoint
- Management raised its full-year Adjusted EPS guidance to $1.30 at the midpoint, a 4% increase
- Operating Margin: 14.8%, up from 13% in the same quarter last year
- Free Cash Flow Margin: 13.1%
- Market Capitalization: $2.03 billion
Company Overview
With a century-long history dating back to 1920 and processing over 15 billion pieces of mail annually, Pitney Bowes (NYSE: PBI) provides shipping, mailing technology, logistics, and financial services to businesses of all sizes.
Revenue Growth
Examining a company’s long-term performance can provide clues about its quality. Any business can experience short-term success, but top-performing ones enjoy sustained growth for years.
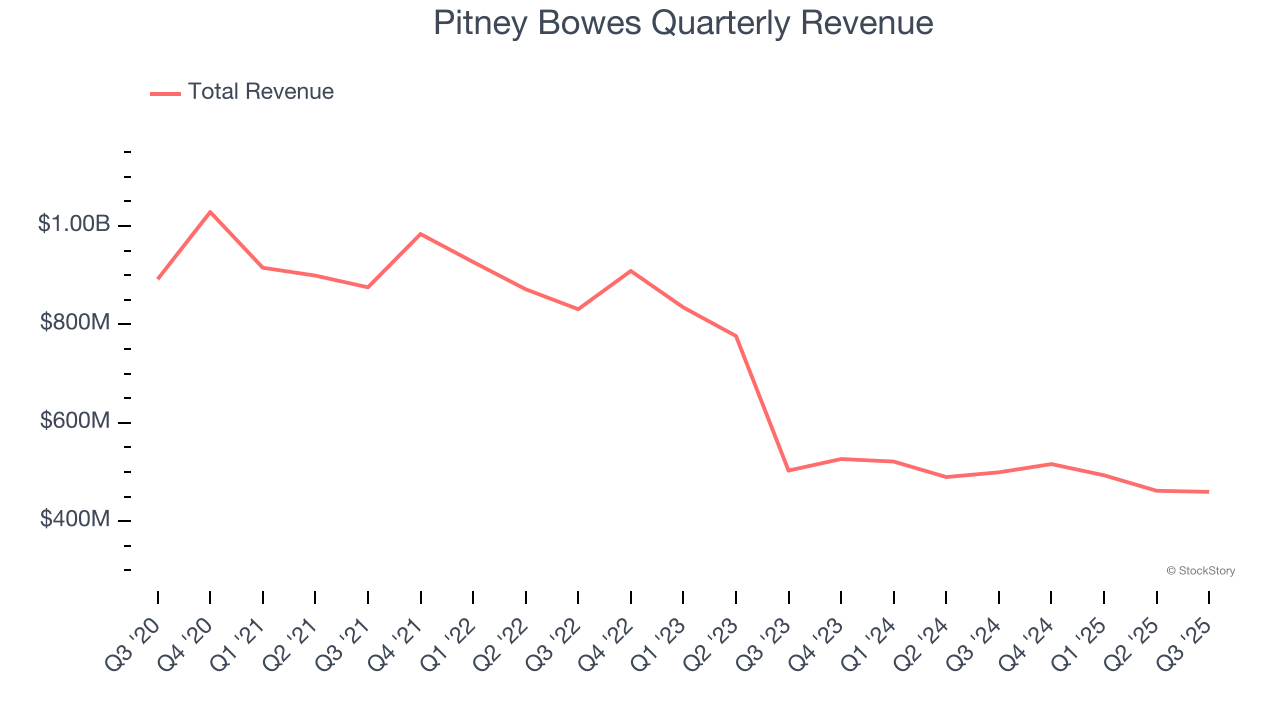
With $1.93 billion in revenue over the past 12 months, Pitney Bowes is a mid-sized business services company, which sometimes brings disadvantages compared to larger competitors benefiting from better economies of scale.
As you can see below, Pitney Bowes struggled to generate demand over the last five years. Its sales dropped by 10.5% annually, a rough starting point for our analysis.
Long-term growth is the most important, but within business services, a half-decade historical view may miss new innovations or demand cycles. Pitney Bowes’s recent performance shows its demand remained suppressed as its revenue has declined by 20.1% annually over the last two years. 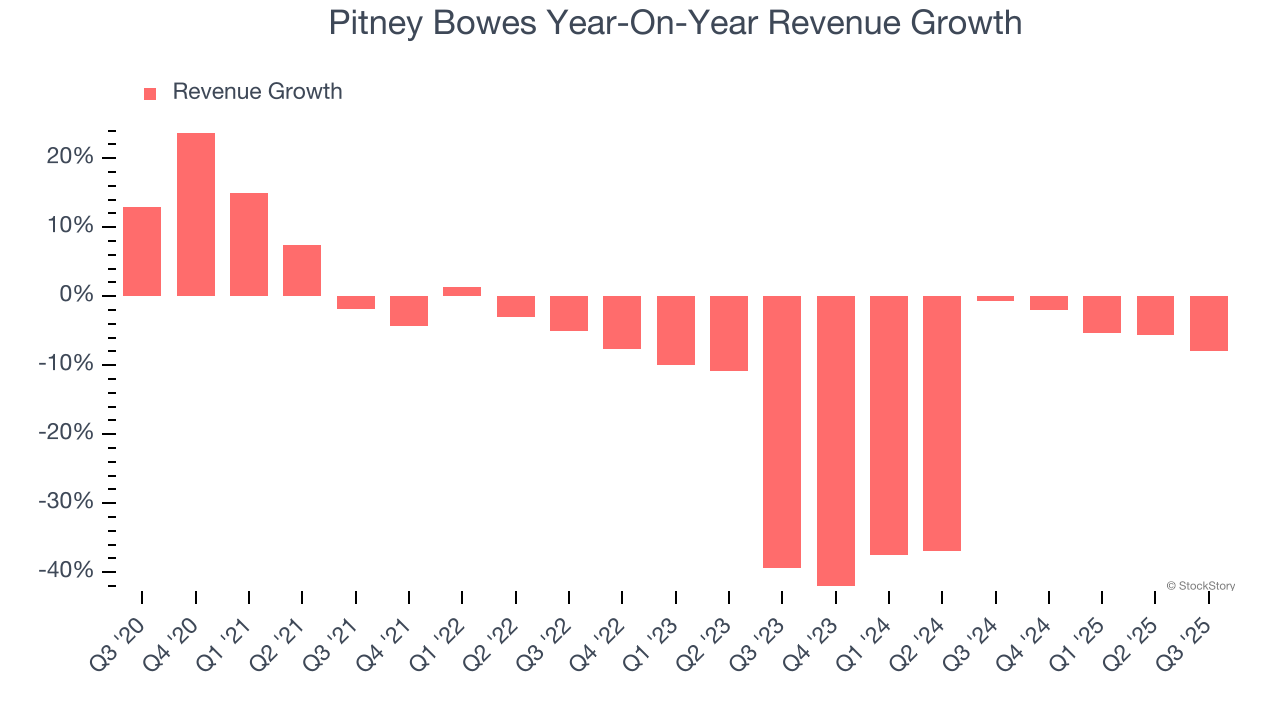
This quarter, Pitney Bowes missed Wall Street’s estimates and reported a rather uninspiring 8% year-on-year revenue decline, generating $459.7 million of revenue.
Looking ahead, sell-side analysts expect revenue to decline by 1% over the next 12 months. While this projection is better than its two-year trend, it’s hard to get excited about a company that is struggling with demand.
Here at StockStory, we certainly understand the potential of thematic investing. Diverse winners from Microsoft (MSFT) to Alphabet (GOOG), Coca-Cola (KO) to Monster Beverage (MNST) could all have been identified as promising growth stories with a megatrend driving the growth. So, in that spirit, we’ve identified a relatively under-the-radar profitable growth stock benefiting from the rise of AI, available to you FREE via this link.
Operating Margin
Operating margin is one of the best measures of profitability because it tells us how much money a company takes home after subtracting all core expenses, like marketing and R&D.
Pitney Bowes was profitable over the last five years but held back by its large cost base. Its average operating margin of 6.6% was weak for a business services business.
On the plus side, Pitney Bowes’s operating margin rose by 9.2 percentage points over the last five years.
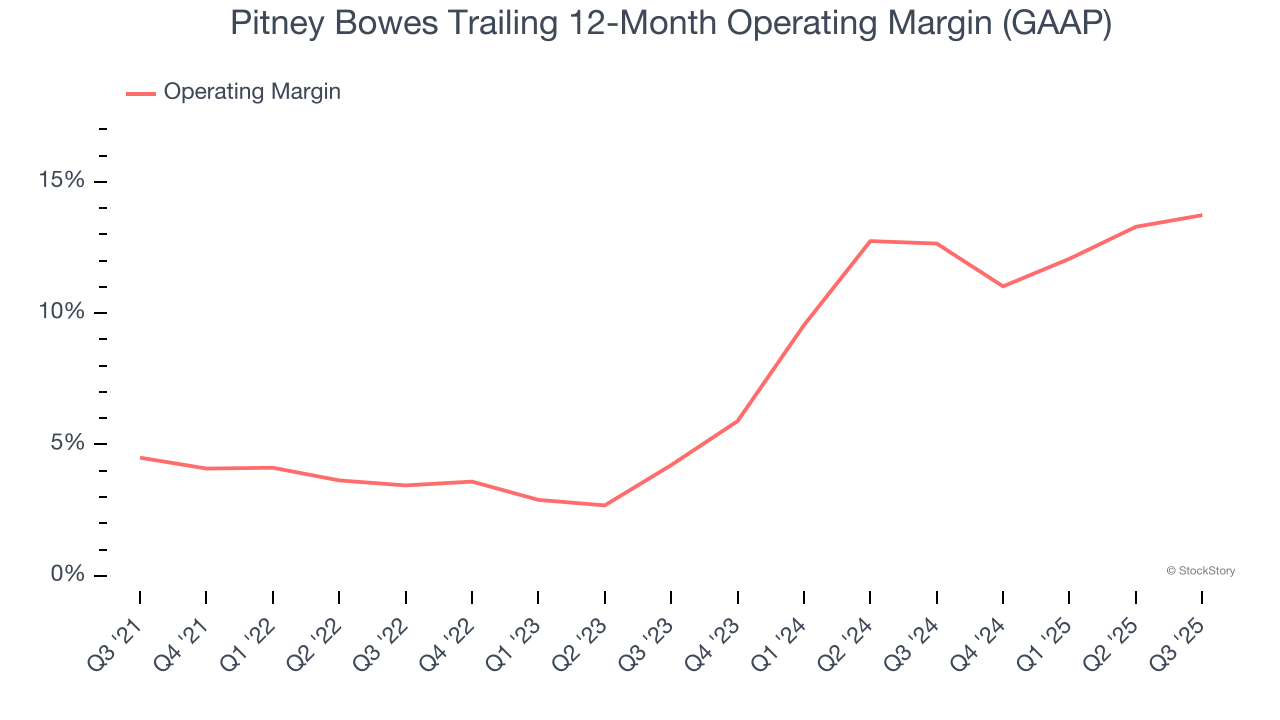
This quarter, Pitney Bowes generated an operating margin profit margin of 14.8%, up 1.8 percentage points year on year. This increase was a welcome development, especially since its revenue fell, showing it was more efficient because it scaled down its expenses.
Earnings Per Share
We track the long-term change in earnings per share (EPS) for the same reason as long-term revenue growth. Compared to revenue, however, EPS highlights whether a company’s growth is profitable.
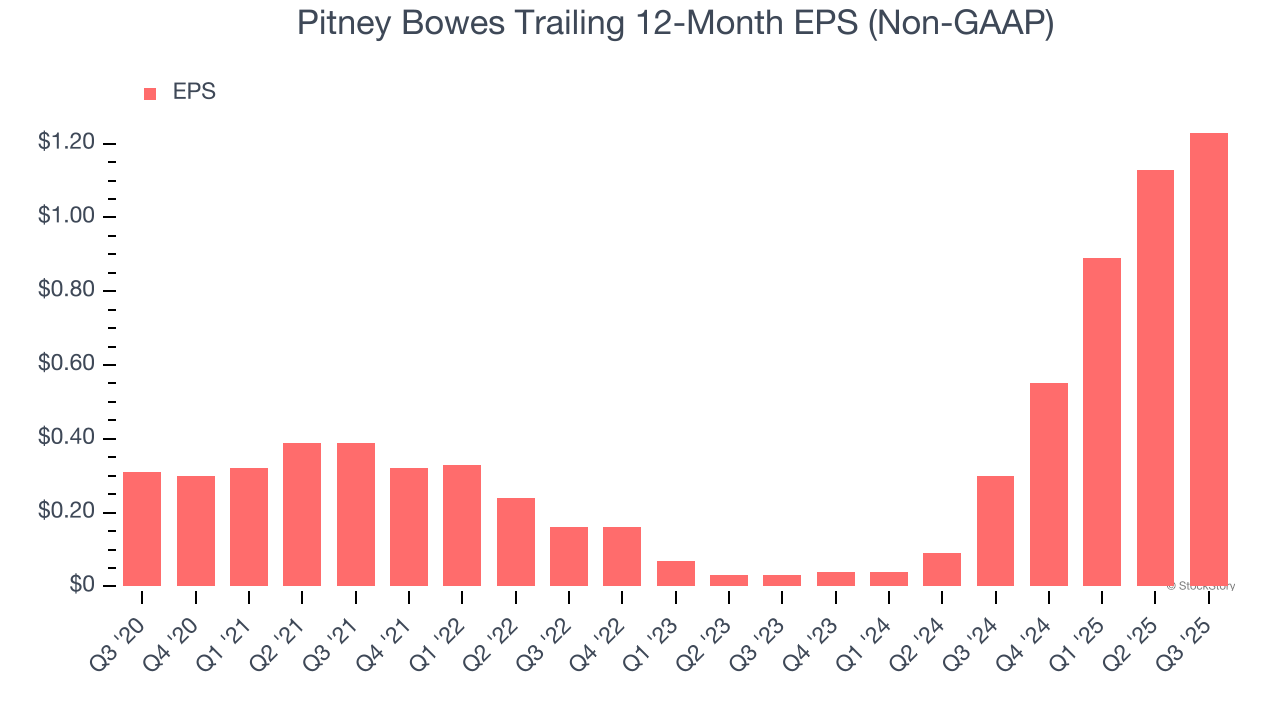
Pitney Bowes’s EPS grew at an astounding 31.7% compounded annual growth rate over the last five years, higher than its 10.5% annualized revenue declines. This tells us management adapted its cost structure in response to a challenging demand environment.
Diving into the nuances of Pitney Bowes’s earnings can give us a better understanding of its performance. As we mentioned earlier, Pitney Bowes’s operating margin expanded by 9.2 percentage points over the last five years. On top of that, its share count shrank by 2.5%. These are positive signs for shareholders because improving profitability and share buybacks turbocharge EPS growth relative to revenue growth. 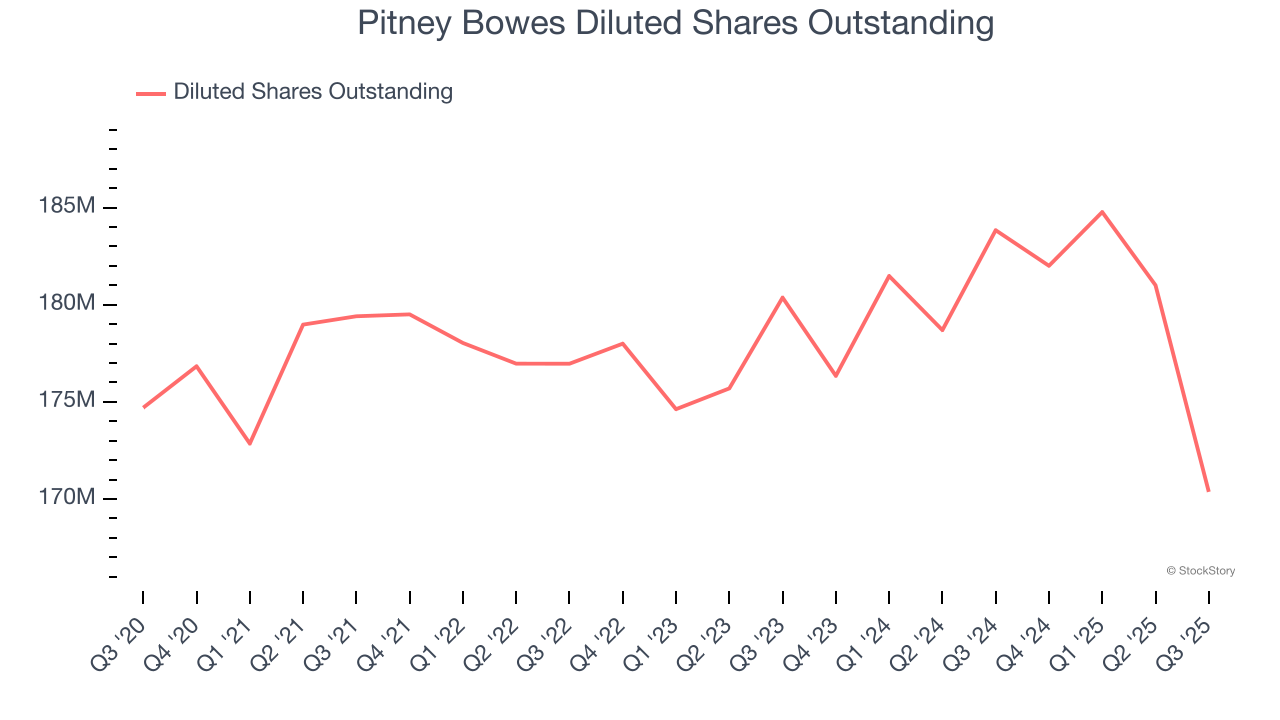
Like with revenue, we analyze EPS over a shorter period to see if we are missing a change in the business.
For Pitney Bowes, its two-year annual EPS growth of 540% was higher than its five-year trend. We love it when earnings growth accelerates, especially when it accelerates off an already high base.
In Q3, Pitney Bowes reported adjusted EPS of $0.31, up from $0.21 in the same quarter last year. Despite growing year on year, this print slightly missed analysts’ estimates, but we care more about long-term adjusted EPS growth than short-term movements. Over the next 12 months, Wall Street expects Pitney Bowes’s full-year EPS of $1.23 to grow 8.1%.
Key Takeaways from Pitney Bowes’s Q3 Results
It was encouraging to see Pitney Bowes beat analysts’ full-year EPS guidance expectations this quarter. On the other hand, its revenue missed and its EPS was in line with Wall Street’s estimates. Overall, this was a weaker quarter. The stock traded down 3.7% to $10.80 immediately after reporting.
Pitney Bowes underperformed this quarter, but does that create an opportunity to invest right now? The latest quarter does matter, but not nearly as much as longer-term fundamentals and valuation, when deciding if the stock is a buy. We cover that in our actionable full research report which you can read here, it’s free for active Edge members.


