
Grocery store chain Sprouts Farmers Market (NASDAQ: SFM) missed Wall Street’s revenue expectations in Q3 CY2025, but sales rose 13.1% year on year to $2.2 billion. Its GAAP profit of $1.22 per share was 4.6% above analysts’ consensus estimates.
Is now the time to buy Sprouts? Find out by accessing our full research report, it’s free for active Edge members.
Sprouts (SFM) Q3 CY2025 Highlights:
- Revenue: $2.2 billion vs analyst estimates of $2.23 billion (13.1% year-on-year growth, 1.1% miss)
- EPS (GAAP): $1.22 vs analyst estimates of $1.17 (4.6% beat)
- Adjusted EBITDA: $198.1 million vs analyst estimates of $193 million (9% margin, 2.7% beat)
- Q4 same-store sales growth guidance: 1% at the midpoint (miss vs expectations of 4.5%)
- EPS (GAAP) guidance for the full year is $5.26 at the midpoint, roughly in line with what analysts were expecting
- Operating Margin: 7.2%, in line with the same quarter last year
- Free Cash Flow Margin: 5.1%, down from 8% in the same quarter last year
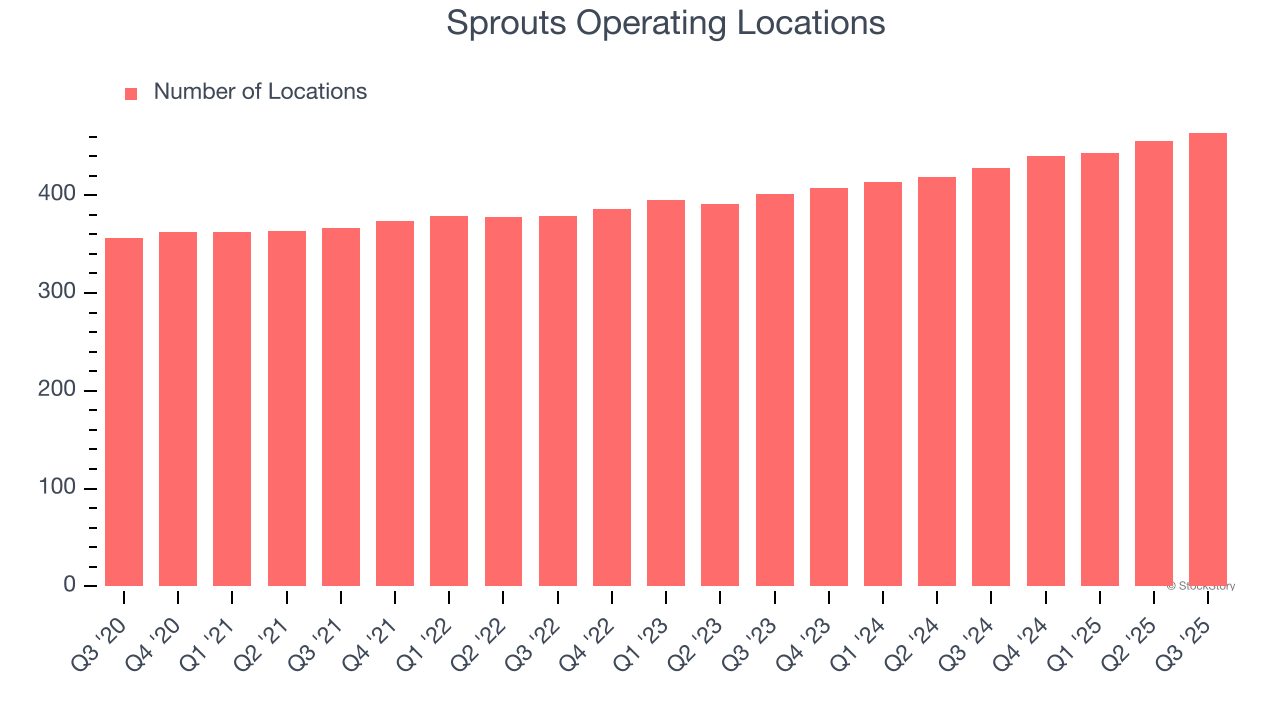
- Locations: 464 at quarter end, up from 428 in the same quarter last year
- Same-Store Sales rose 5.9% year on year (8.4% in the same quarter last year)
- Market Capitalization: $10.44 billion
"We are opening stores nationwide, and our strategy continues to resonate with our target customers, resulting in strong third quarter performance," said Jack Sinclair, chief executive officer of Sprouts Farmers Market.
Company Overview
Playing on the secular trend of healthier living, Sprouts Farmers Market (NASDAQ: SFM) is a grocery store chain emphasizing natural and organic products.
Revenue Growth
Reviewing a company’s long-term sales performance reveals insights into its quality. Any business can experience short-term success, but top-performing ones enjoy sustained growth for years.
With $8.65 billion in revenue over the past 12 months, Sprouts is a mid-sized retailer, which sometimes brings disadvantages compared to larger competitors benefiting from better economies of scale.
As you can see below, Sprouts grew its sales at a mediocre 7.7% compounded annual growth rate over the last six years (we compare to 2019 to normalize for COVID-19 impacts), but to its credit, it opened new stores and increased sales at existing, established locations.
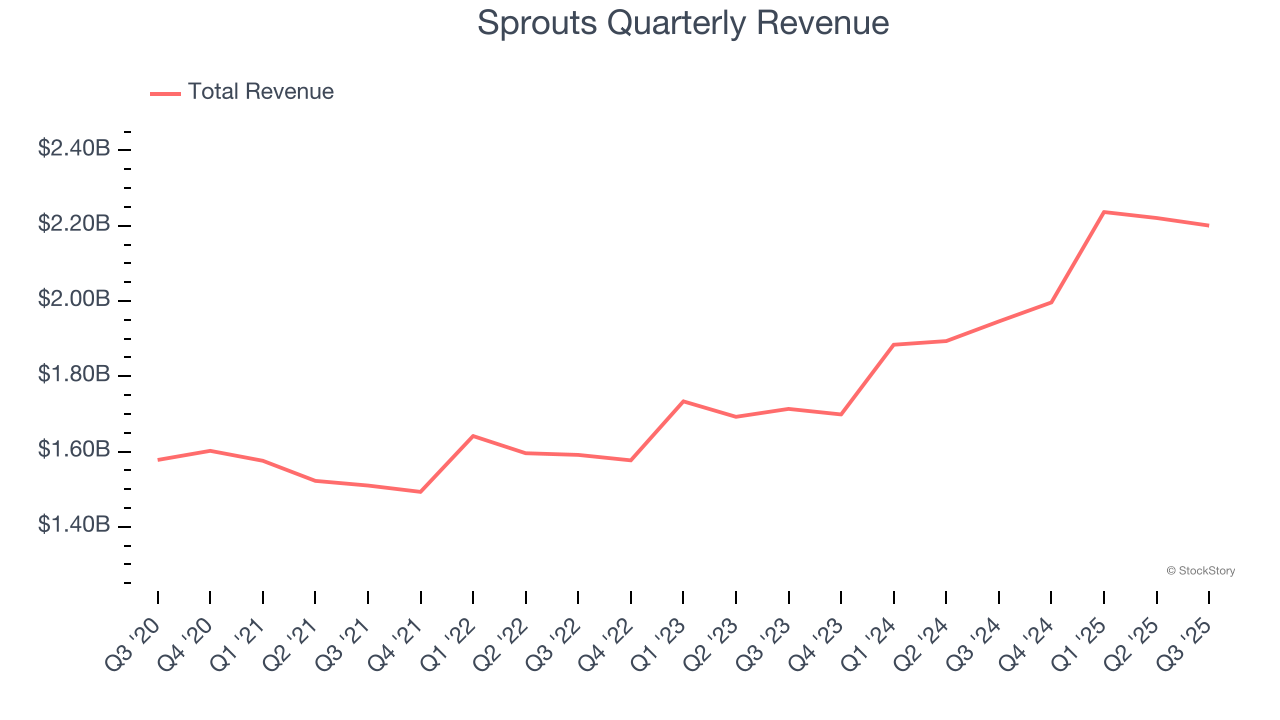
This quarter, Sprouts’s revenue grew by 13.1% year on year to $2.2 billion but fell short of Wall Street’s estimates.
Looking ahead, sell-side analysts expect revenue to grow 11.1% over the next 12 months, an acceleration versus the last six years. This projection is eye-popping and indicates its newer products will fuel better top-line performance.
Here at StockStory, we certainly understand the potential of thematic investing. Diverse winners from Microsoft (MSFT) to Alphabet (GOOG), Coca-Cola (KO) to Monster Beverage (MNST) could all have been identified as promising growth stories with a megatrend driving the growth. So, in that spirit, we’ve identified a relatively under-the-radar profitable growth stock benefiting from the rise of AI, available to you FREE via this link.
Store Performance
Number of Stores
A retailer’s store count influences how much it can sell and how quickly revenue can grow.
Sprouts operated 464 locations in the latest quarter. It has opened new stores at a rapid clip over the last two years, averaging 7% annual growth, much faster than the broader consumer retail sector. This gives it a chance to become a large, scaled business over time.
When a retailer opens new stores, it usually means it’s investing for growth because demand is greater than supply, especially in areas where consumers may not have a store within reasonable driving distance.
Same-Store Sales
The change in a company's store base only tells one side of the story. The other is the performance of its existing locations and e-commerce sales, which informs management teams whether they should expand or downsize their physical footprints. Same-store sales is an industry measure of whether revenue is growing at those existing stores and is driven by customer visits (often called traffic) and the average spending per customer (ticket).
Sprouts has been one of the most successful retailers over the last two years thanks to skyrocketing demand within its existing locations. On average, the company has posted exceptional year-on-year same-store sales growth of 7.7%. This performance suggests its rollout of new stores is beneficial for shareholders. We like this backdrop because it gives Sprouts multiple ways to win: revenue growth can come from new stores, e-commerce, or increased foot traffic and higher sales per customer at existing locations.
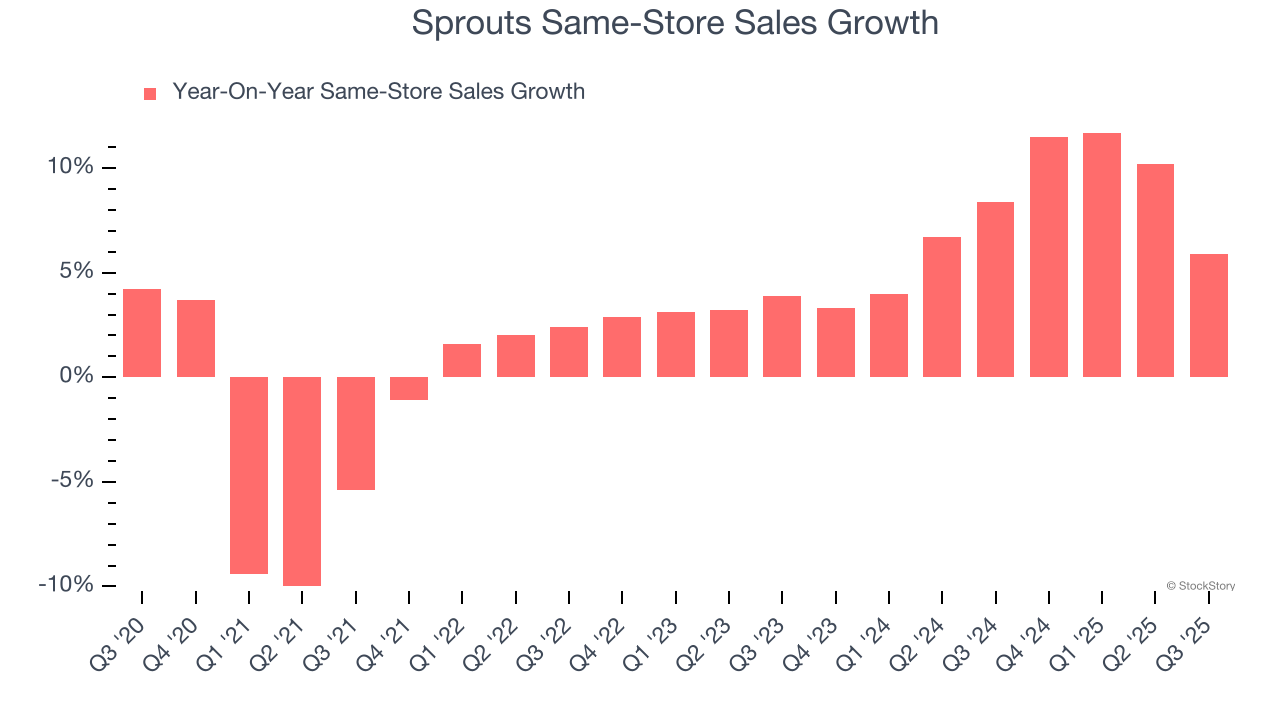
In the latest quarter, Sprouts’s same-store sales rose 5.9% year on year. This growth was a deceleration from its historical levels, showing the business is still performing well but losing a bit of steam.
Key Takeaways from Sprouts’s Q3 Results
It was encouraging to see Sprouts beat analysts’ EPS expectations this quarter. On the other hand, its revenue missed and its Q4 same-store sales growth guidance missed significantly. Additionally, full-year EPS guidance fell slightly short of Wall Street’s estimates. Zooming out, we think this quarter could have been better, and shares traded down 18.8% to $85.20 immediately following the results.
Is Sprouts an attractive investment opportunity right now? The latest quarter does matter, but not nearly as much as longer-term fundamentals and valuation, when deciding if the stock is a buy. We cover that in our actionable full research report which you can read here, it’s free for active Edge members.


