
Digital medical services platform Teladoc Health (NYSE: TDOC) met Wall Streets revenue expectations in Q3 CY2025, but sales fell by 2.2% year on year to $626.4 million. The company expects next quarter’s revenue to be around $637 million, close to analysts’ estimates. Its GAAP loss of $0.28 per share was 9.2% below analysts’ consensus estimates.
Is now the time to buy Teladoc? Find out by accessing our full research report, it’s free for active Edge members.
Teladoc (TDOC) Q3 CY2025 Highlights:
- Revenue: $626.4 million vs analyst estimates of $625.8 million (2.2% year-on-year decline, in line)
- EPS (GAAP): -$0.28 vs analyst expectations of -$0.26 (9.2% miss)
- Adjusted EBITDA: $66.07 million vs analyst estimates of $64.95 million (10.5% margin, 1.7% beat)
- Revenue Guidance for Q4 CY2025 is $637 million at the midpoint, roughly in line with what analysts were expecting
- EPS (GAAP) guidance for the full year is -$1.18 at the midpoint, missing analyst estimates by 14.3%
- EBITDA guidance for the full year is $278.5 million at the midpoint, above analyst estimates of $274.2 million
- Operating Margin: -8.3%, down from -6.9% in the same quarter last year
- Free Cash Flow Margin: 0%, down from 14.3% in the previous quarter
- Market Capitalization: $1.48 billion
“In the third quarter, we again delivered consolidated revenues and adjusted EBITDA in the upper half of our guidance ranges, reflecting consistent execution along with our steadfast commitment to serving our clients and members,” said Chuck Divita, Chief Executive Officer of Teladoc Health.
Company Overview
Founded to help people in rural areas get online medical consultations, Teladoc Health (NYSE: TDOC) is a telemedicine platform that facilitates remote doctor’s visits.
Revenue Growth
A company’s long-term sales performance is one signal of its overall quality. Any business can experience short-term success, but top-performing ones enjoy sustained growth for years. Regrettably, Teladoc’s sales grew at a sluggish 2.9% compounded annual growth rate over the last three years. This fell short of our benchmarks and is a rough starting point for our analysis.
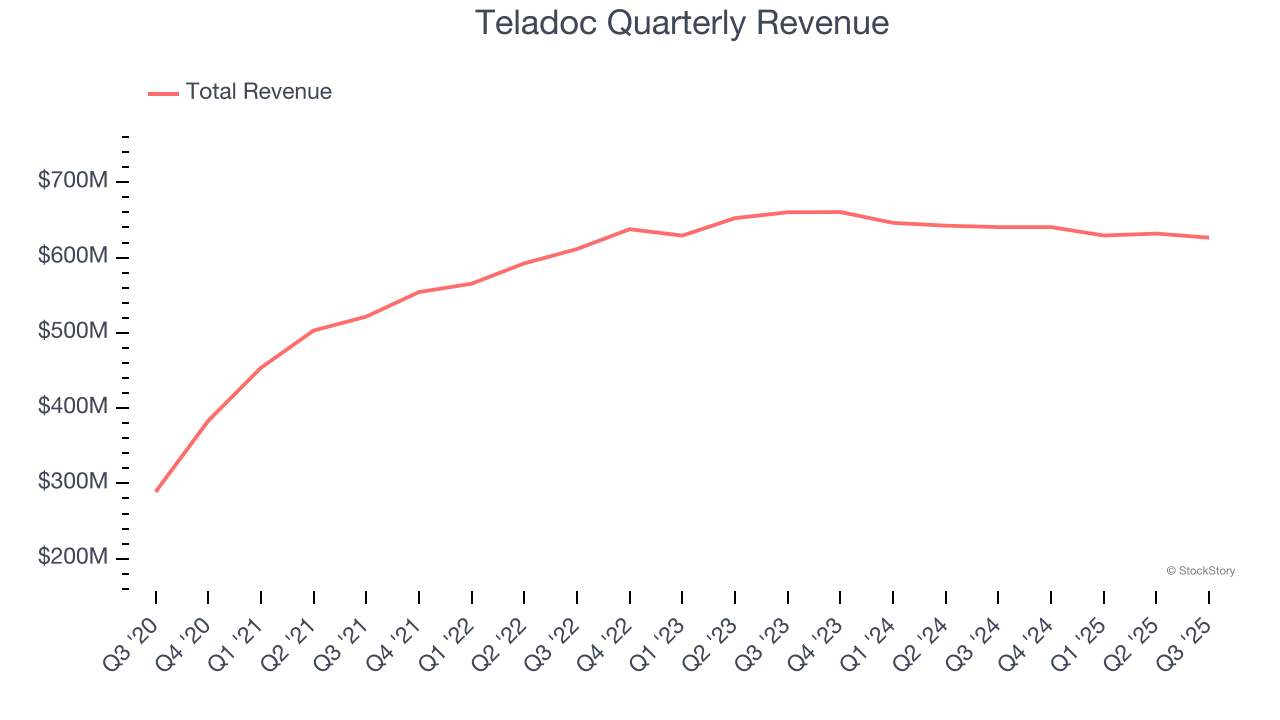
This quarter, Teladoc reported a rather uninspiring 2.2% year-on-year revenue decline to $626.4 million of revenue, in line with Wall Street’s estimates. Company management is currently guiding for flat sales next quarter.
Looking further ahead, sell-side analysts expect revenue to remain flat over the next 12 months, a slight deceleration versus the last three years. This projection doesn't excite us and suggests its products and services will face some demand challenges.
Unless you’ve been living under a rock, it should be obvious by now that generative AI is going to have a huge impact on how large corporations do business. While Nvidia and AMD are trading close to all-time highs, we prefer a lesser-known (but still profitable) stock benefiting from the rise of AI. Click here to access our free report one of our favorites growth stories.
Cash Is King
Although EBITDA is undoubtedly valuable for assessing company performance, we believe cash is king because you can’t use accounting profits to pay the bills.
Teladoc has shown impressive cash profitability, driven by its attractive business model that gives it the option to reinvest or return capital to investors. The company’s free cash flow margin averaged 10.1% over the last two years, better than the broader consumer internet sector.
Taking a step back, we can see that Teladoc’s margin dropped by 1.1 percentage points over the last few years. If its declines continue, it could signal increasing investment needs and capital intensity.
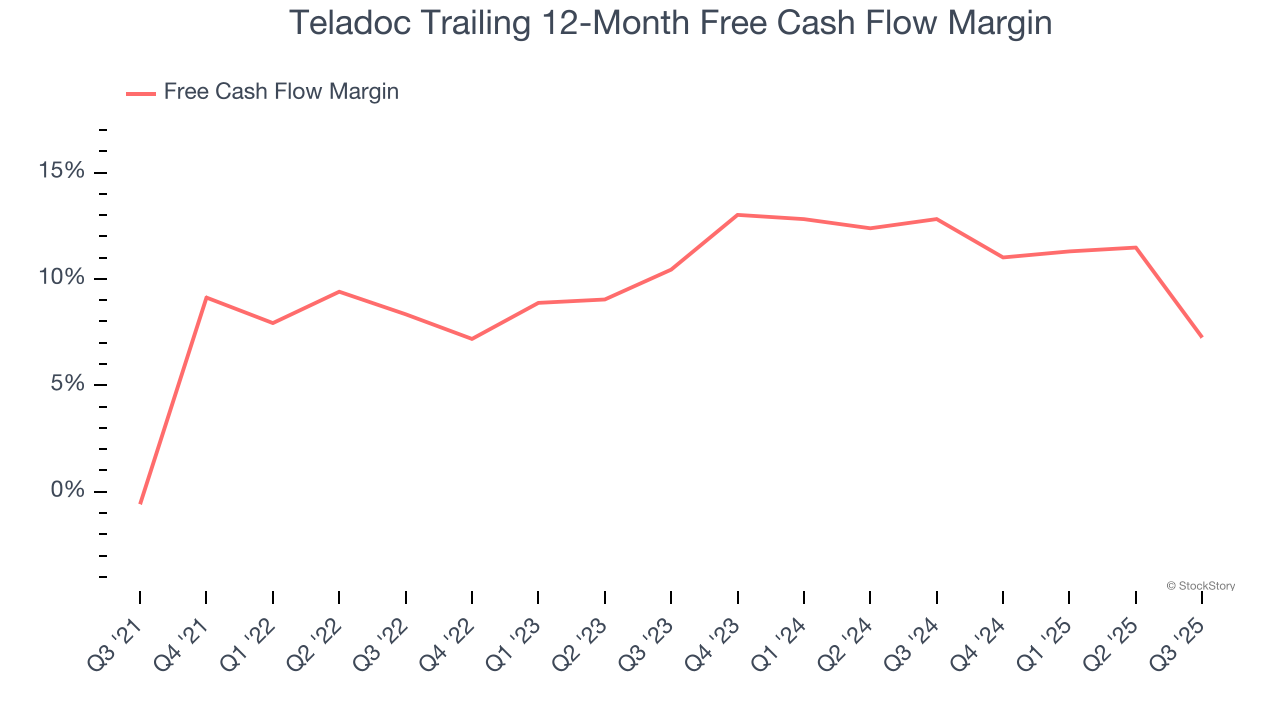
Teladoc broke even from a free cash flow perspective in Q3. The company’s cash profitability regressed as it was 16.9 percentage points lower than in the same quarter last year, suggesting its historical struggles have dragged on.
Key Takeaways from Teladoc’s Q3 Results
It was great to see Teladoc’s full-year EBITDA guidance top analysts’ expectations. We were also happy its EBITDA outperformed Wall Street’s estimates. On the other hand, its EPS and full-year EPS guidance missed. Overall, this print had some key positives. The market seemed to be hoping for more, and the stock traded down 1.5% to $8.10 immediately after reporting.
Is Teladoc an attractive investment opportunity at the current price? The latest quarter does matter, but not nearly as much as longer-term fundamentals and valuation, when deciding if the stock is a buy. We cover that in our actionable full research report which you can read here, it’s free for active Edge members.


