
Industrial products company CSW (NASDAQ: CSW) missed Wall Street’s revenue expectations in Q3 CY2025, but sales rose 21.5% year on year to $277 million. Its non-GAAP profit of $2.96 per share was 7.2% above analysts’ consensus estimates.
Is now the time to buy CSW? Find out by accessing our full research report, it’s free for active Edge members.
CSW (CSW) Q3 CY2025 Highlights:
- Revenue: $277 million vs analyst estimates of $278.4 million (21.5% year-on-year growth, 0.5% miss)
- Adjusted EPS: $2.96 vs analyst estimates of $2.76 (7.2% beat)
- Adjusted EBITDA: $72.94 million vs analyst estimates of $71.29 million (26.3% margin, 2.3% beat)
- Operating Margin: 20.5%, down from 22.6% in the same quarter last year
- Free Cash Flow Margin: 21.2%, down from 26.9% in the same quarter last year
- Market Capitalization: $4.10 billion
Company Overview
With over two centuries of combined operations manufacturing and supplying, CSW (NASDAQ: CSW) offers special chemicals, coatings, sealants, and lubricants for various industries.
Revenue Growth
A company’s long-term sales performance can indicate its overall quality. Any business can put up a good quarter or two, but the best consistently grow over the long haul. Over the last five years, CSW grew its sales at an incredible 20.6% compounded annual growth rate. Its growth surpassed the average industrials company and shows its offerings resonate with customers, a great starting point for our analysis.
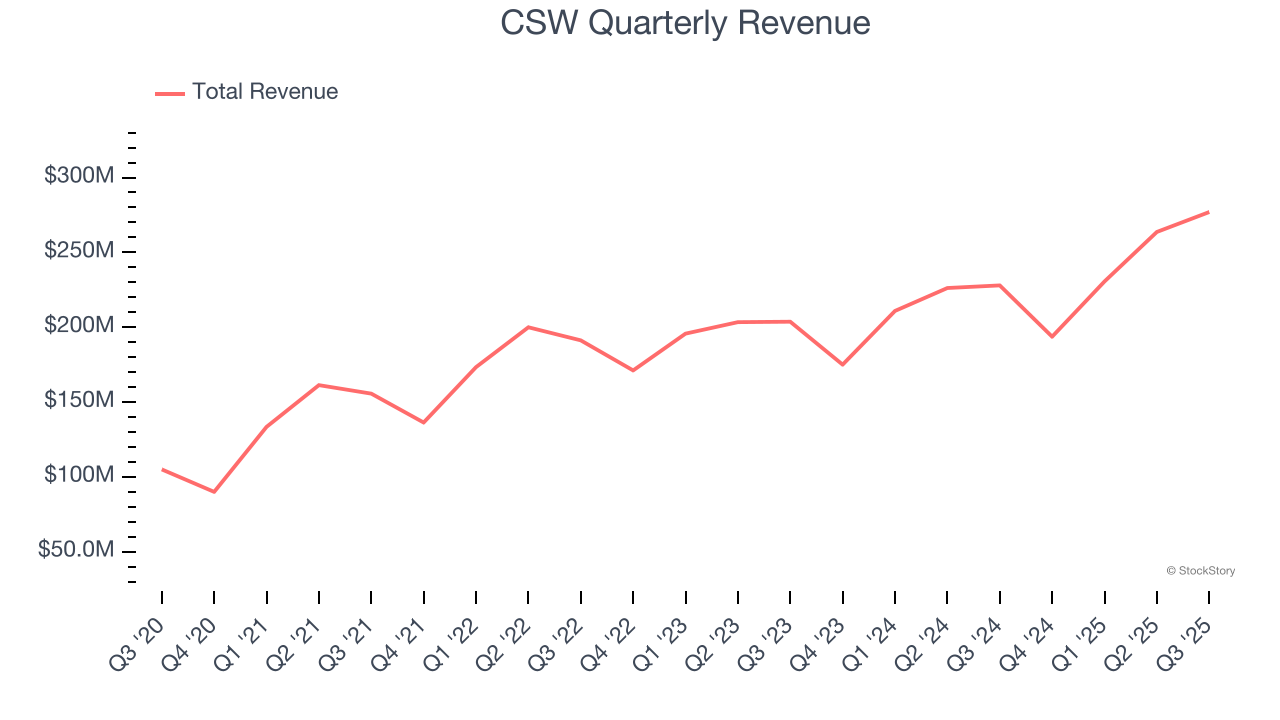
Long-term growth is the most important, but within industrials, a half-decade historical view may miss new industry trends or demand cycles. CSW’s annualized revenue growth of 11.7% over the last two years is below its five-year trend, but we still think the results suggest healthy demand. 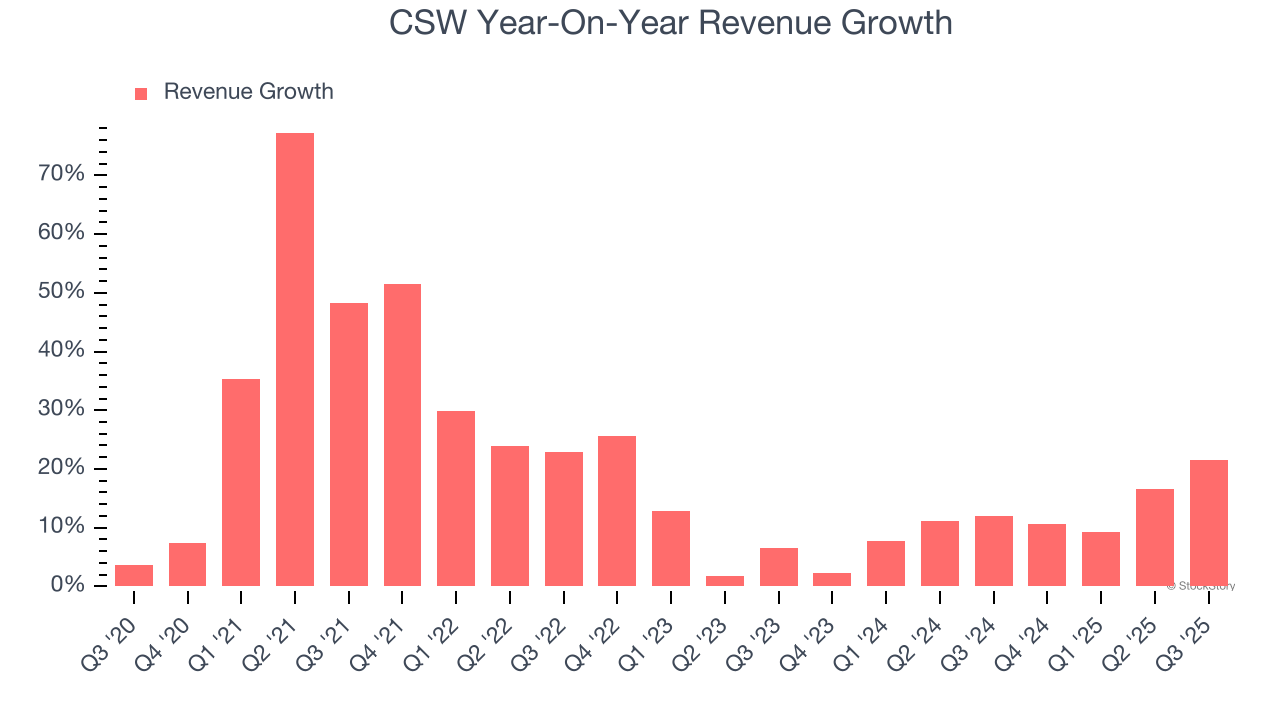
This quarter, CSW generated an excellent 21.5% year-on-year revenue growth rate, but its $277 million of revenue fell short of Wall Street’s high expectations.
Looking ahead, sell-side analysts expect revenue to grow 15.1% over the next 12 months, an improvement versus the last two years. This projection is eye-popping and implies its newer products and services will fuel better top-line performance.
Today’s young investors won’t have read the timeless lessons in Gorilla Game: Picking Winners In High Technology because it was written more than 20 years ago when Microsoft and Apple were first establishing their supremacy. But if we apply the same principles, then enterprise software stocks leveraging their own generative AI capabilities may well be the Gorillas of the future. So, in that spirit, we are excited to present our Special Free Report on a profitable, fast-growing enterprise software stock that is already riding the automation wave and looking to catch the generative AI next.
Operating Margin
CSW has been a well-oiled machine over the last five years. It demonstrated elite profitability for an industrials business, boasting an average operating margin of 19%. This result isn’t surprising as its high gross margin gives it a favorable starting point.
Looking at the trend in its profitability, CSW’s operating margin rose by 3.5 percentage points over the last five years, as its sales growth gave it operating leverage.
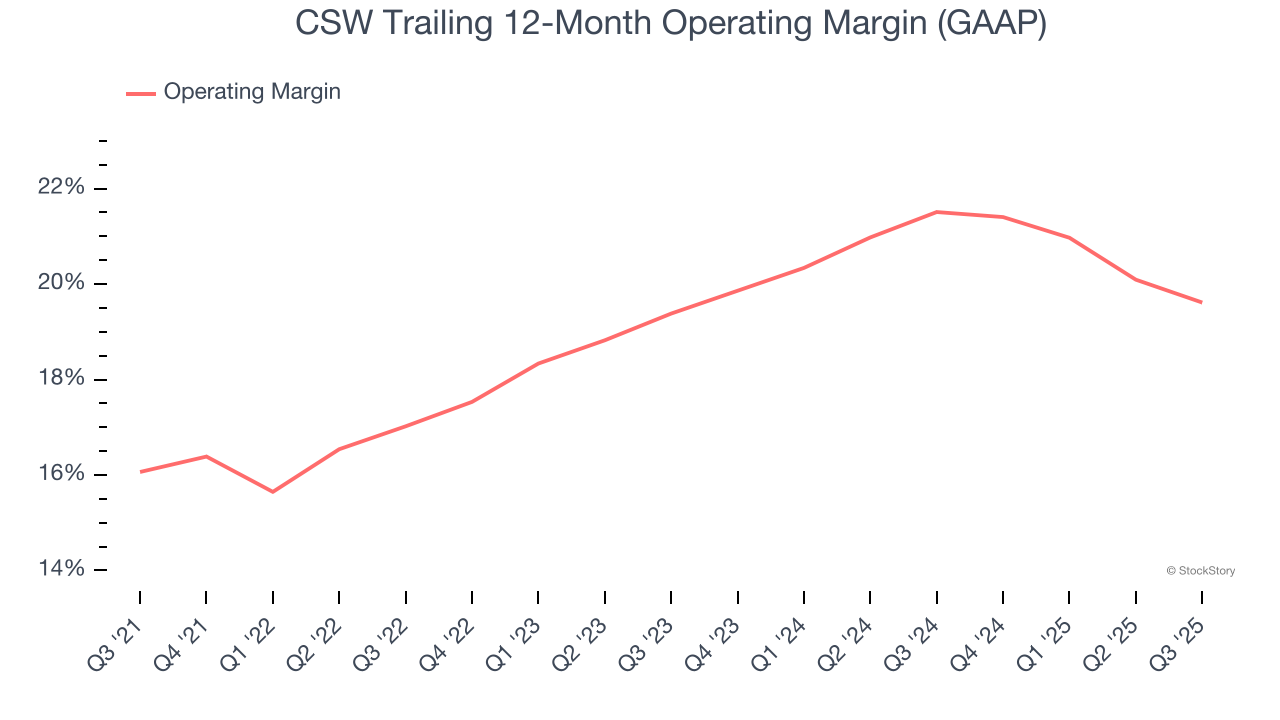
This quarter, CSW generated an operating margin profit margin of 20.5%, down 2.1 percentage points year on year. Conversely, its revenue and gross margin actually rose, so we can assume it was less efficient because its operating expenses like marketing, R&D, and administrative overhead grew faster than its revenue.
Earnings Per Share
Revenue trends explain a company’s historical growth, but the long-term change in earnings per share (EPS) points to the profitability of that growth – for example, a company could inflate its sales through excessive spending on advertising and promotions.
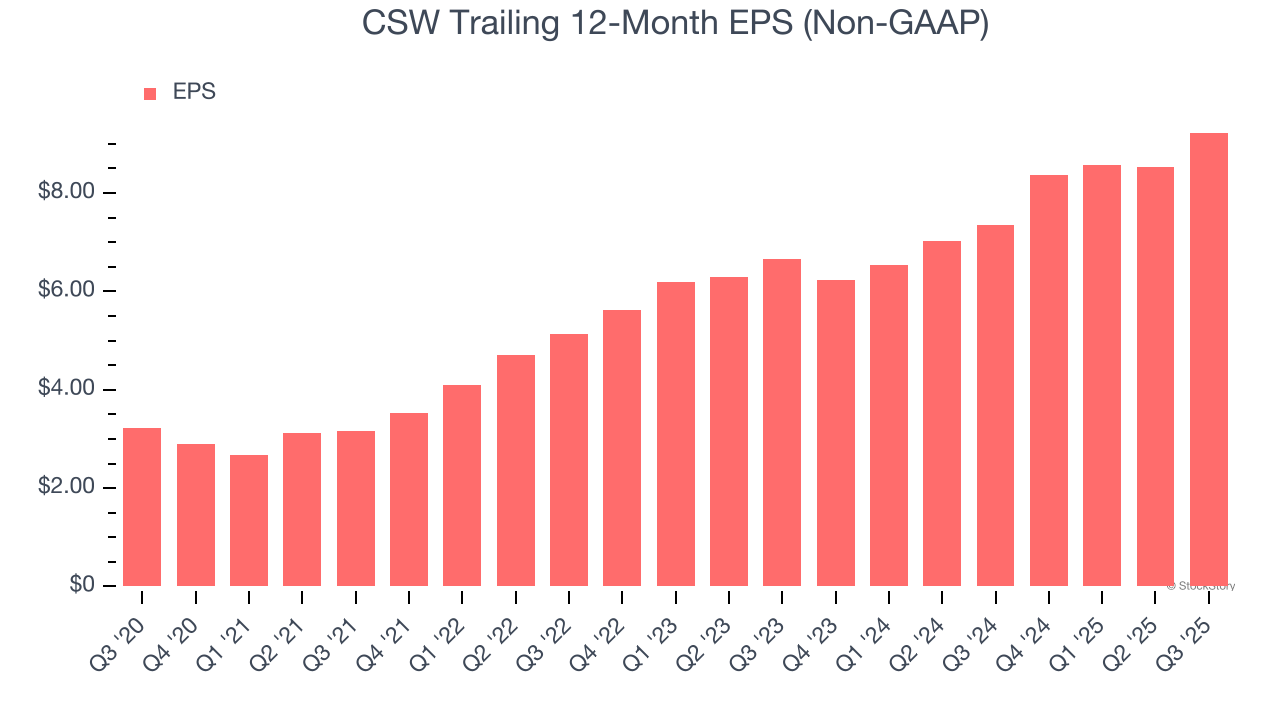
CSW’s EPS grew at an astounding 23.4% compounded annual growth rate over the last five years, higher than its 20.6% annualized revenue growth. This tells us the company became more profitable on a per-share basis as it expanded.
Diving into the nuances of CSW’s earnings can give us a better understanding of its performance. As we mentioned earlier, CSW’s operating margin declined this quarter but expanded by 3.5 percentage points over the last five years. This was the most relevant factor (aside from the revenue impact) behind its higher earnings; interest expenses and taxes can also affect EPS but don’t tell us as much about a company’s fundamentals.
Like with revenue, we analyze EPS over a shorter period to see if we are missing a change in the business.
For CSW, its two-year annual EPS growth of 17.8% was lower than its five-year trend. We still think its growth was good and hope it can accelerate in the future.
In Q3, CSW reported adjusted EPS of $2.96, up from $2.26 in the same quarter last year. This print beat analysts’ estimates by 7.2%. Over the next 12 months, Wall Street expects CSW’s full-year EPS of $9.23 to grow 18.1%.
Key Takeaways from CSW’s Q3 Results
It was encouraging to see CSW beat analysts’ EPS expectations this quarter. On the other hand, its revenue slightly missed. Overall, this print was mixed. The stock remained flat at $244.11 immediately following the results.
So do we think CSW is an attractive buy at the current price? We think that the latest quarter is only one piece of the longer-term business quality puzzle. Quality, when combined with valuation, can help determine if the stock is a buy. We cover that in our actionable full research report which you can read here, it’s free for active Edge members.


