IT services provider DXC Technology (NYSE: DXC) met Wall Streets revenue expectations in Q3 CY2025, but sales fell by 2.5% year on year to $3.16 billion. The company expects next quarter’s revenue to be around $3.2 billion, close to analysts’ estimates. Its GAAP profit of $0.20 per share was 20% below analysts’ consensus estimates.
Is now the time to buy DXC? Find out by accessing our full research report, it’s free for active Edge members.
DXC (DXC) Q3 CY2025 Highlights:
- Revenue: $3.16 billion vs analyst estimates of $3.17 billion (2.5% year-on-year decline, in line)
- EPS (GAAP): $0.20 vs analyst expectations of $0.25 (20% miss)
- Adjusted EBITDA: $457 million vs analyst estimates of $444.7 million (14.5% margin, 2.8% beat)
- The company reconfirmed its revenue guidance for the full year of $12.74 billion at the midpoint
- Operating Margin: 4.4%, down from 5.8% in the same quarter last year
- Free Cash Flow Margin: 13%, up from 1.5% in the same quarter last year
- Organic Revenue fell 4.2% year on year vs analyst estimates of 4% declines (17.9 basis point miss)
- Market Capitalization: $2.36 billion
Company Overview
Born from the 2017 merger of Computer Sciences Corporation and HP Enterprise's services business, DXC Technology (NYSE: DXC) is a global IT services company that helps businesses transform their technology infrastructure, applications, and operations.
Revenue Growth
Reviewing a company’s long-term sales performance reveals insights into its quality. Even a bad business can shine for one or two quarters, but a top-tier one grows for years.
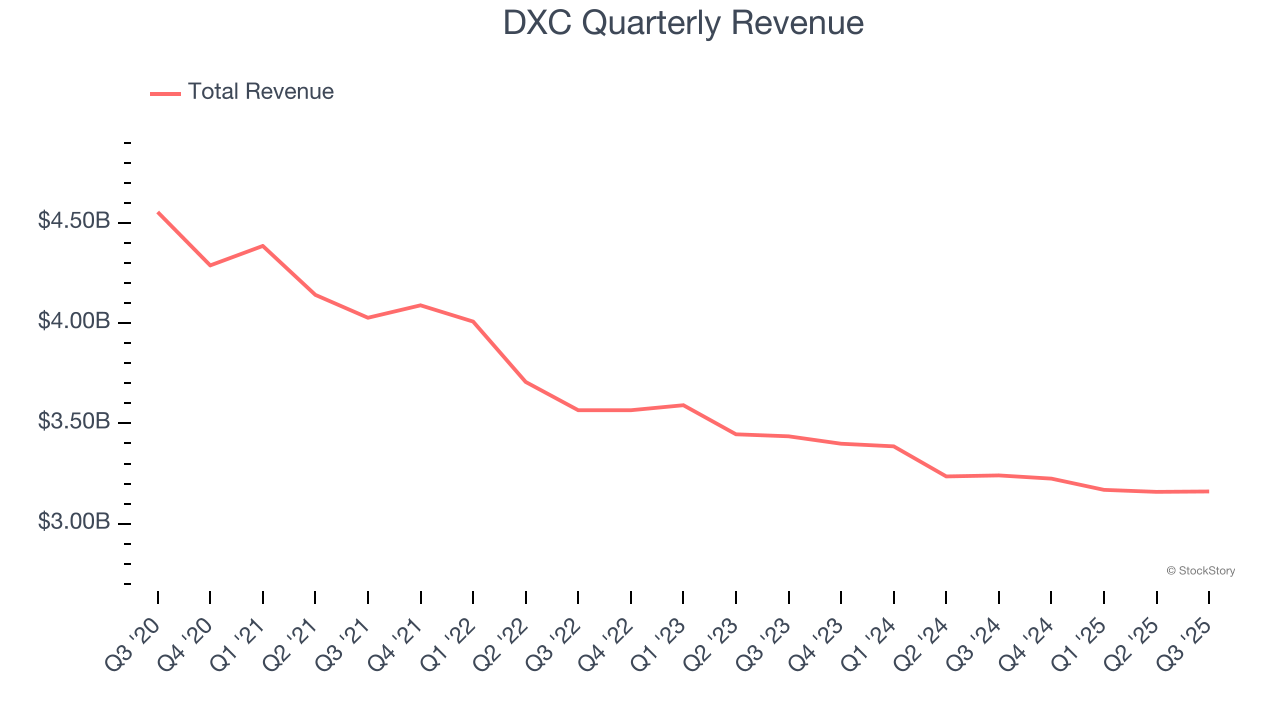
With $12.71 billion in revenue over the past 12 months, DXC is larger than most business services companies and benefits from economies of scale, enabling it to gain more leverage on its fixed costs than smaller competitors. This also gives it the flexibility to offer lower prices. However, its scale is a double-edged sword because finding new avenues for growth becomes difficult when you already have a substantial market presence. To accelerate sales, DXC likely needs to optimize its pricing or lean into new offerings and international expansion.
As you can see below, DXC struggled to generate demand over the last five years. Its sales dropped by 7.6% annually, a poor baseline for our analysis.
Long-term growth is the most important, but within business services, a half-decade historical view may miss new innovations or demand cycles. DXC’s annualized revenue declines of 4.8% over the last two years suggest its demand continued shrinking. 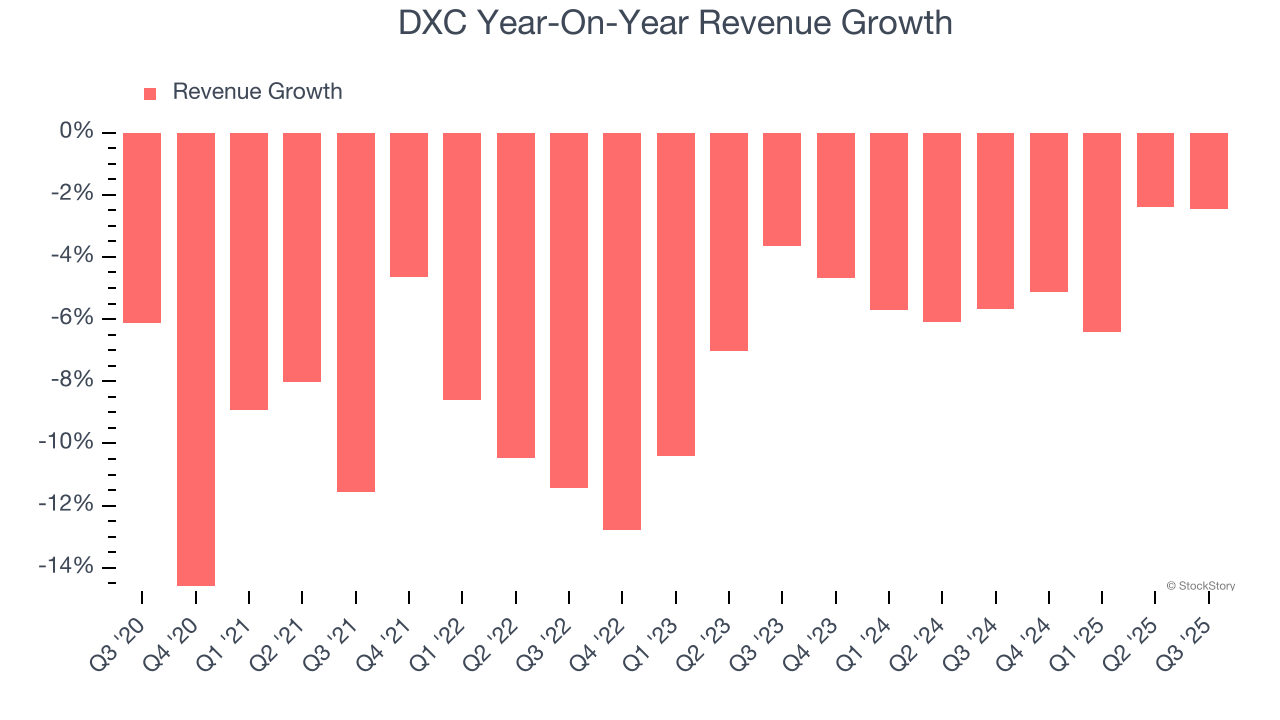
We can better understand the company’s sales dynamics by analyzing its organic revenue, which strips out one-time events like acquisitions and currency fluctuations that don’t accurately reflect its fundamentals. Over the last two years, DXC’s organic revenue averaged 4.5% year-on-year declines. Because this number aligns with its two-year revenue growth, we can see the company’s core operations (not acquisitions and divestitures) drove most of its results. 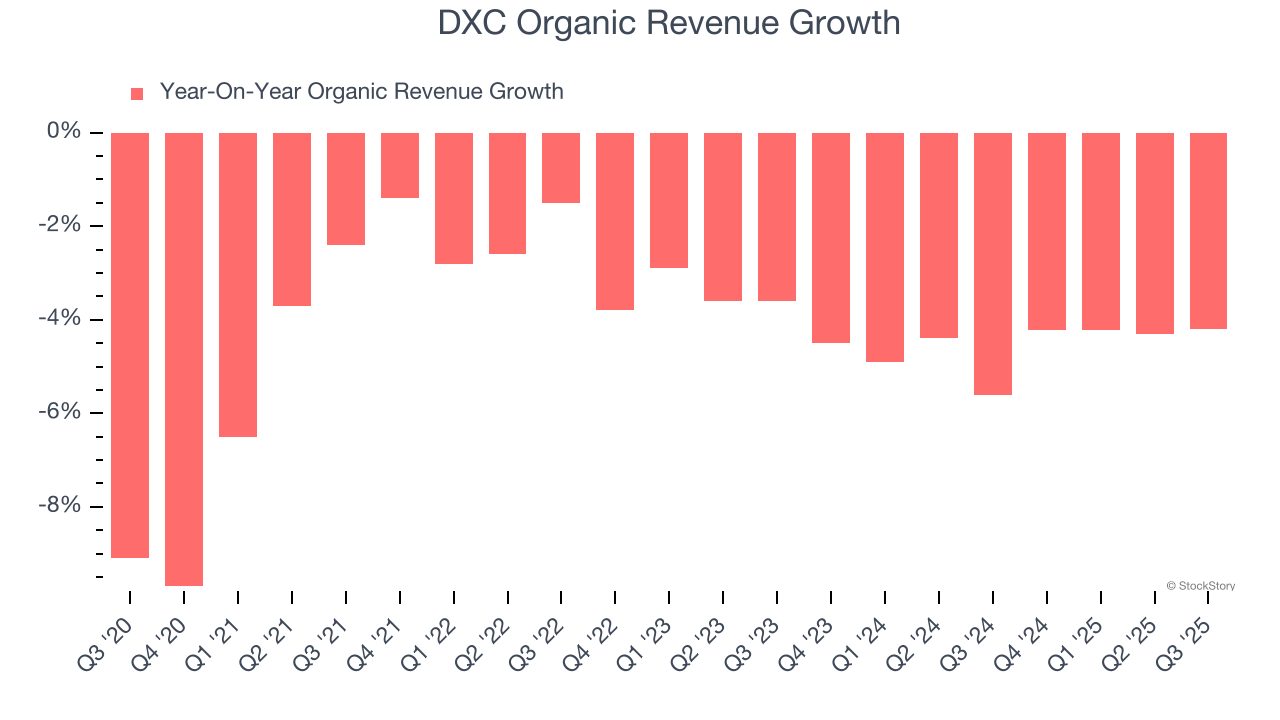
This quarter, DXC reported a rather uninspiring 2.5% year-on-year revenue decline to $3.16 billion of revenue, in line with Wall Street’s estimates. Company management is currently guiding for flat sales next quarter.
Looking further ahead, sell-side analysts expect revenue to decline by 1.3% over the next 12 months. Although this projection is better than its two-year trend, it’s hard to get excited about a company that is struggling with demand.
Today’s young investors won’t have read the timeless lessons in Gorilla Game: Picking Winners In High Technology because it was written more than 20 years ago when Microsoft and Apple were first establishing their supremacy. But if we apply the same principles, then enterprise software stocks leveraging their own generative AI capabilities may well be the Gorillas of the future. So, in that spirit, we are excited to present our Special Free Report on a profitable, fast-growing enterprise software stock that is already riding the automation wave and looking to catch the generative AI next.
Operating Margin
Operating margin is an important measure of profitability as it shows the portion of revenue left after accounting for all core expenses – everything from the cost of goods sold to advertising and wages. It’s also useful for comparing profitability across companies with different levels of debt and tax rates because it excludes interest and taxes.
DXC was profitable over the last five years but held back by its large cost base. Its average operating margin of 2.7% was weak for a business services business.
On the plus side, DXC’s operating margin rose by 5 percentage points over the last five years.
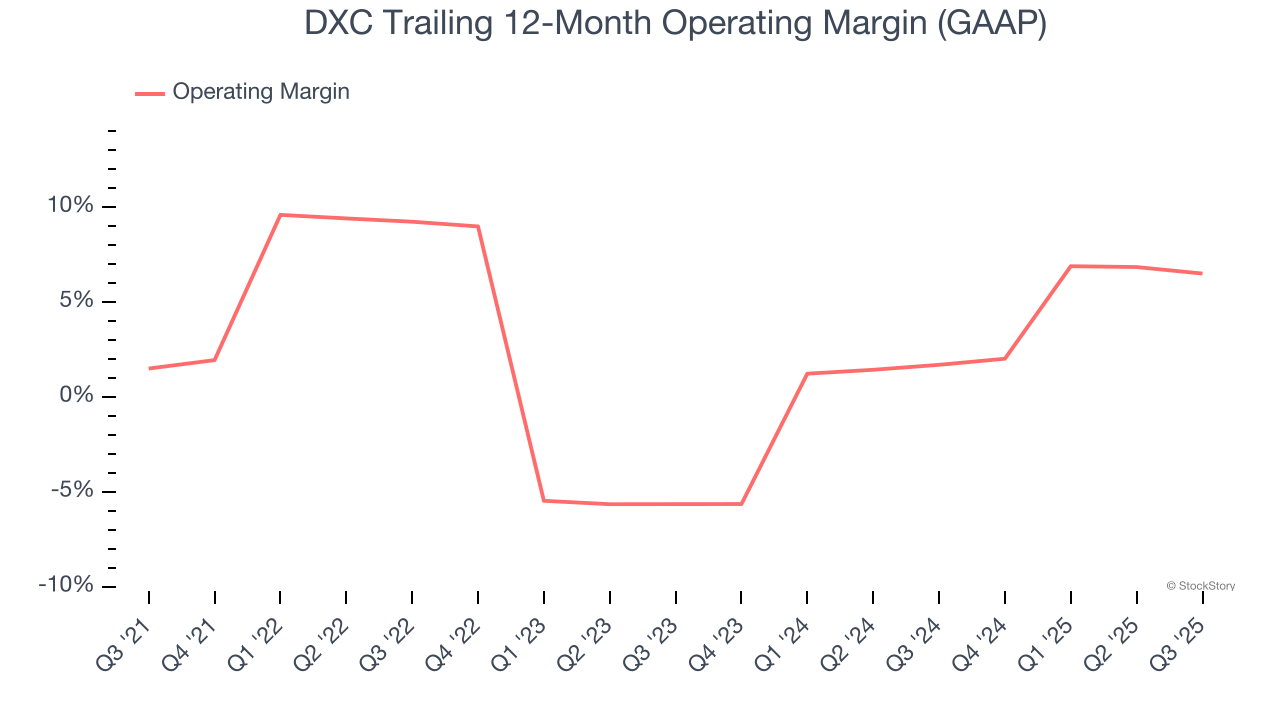
In Q3, DXC generated an operating margin profit margin of 4.4%, down 1.4 percentage points year on year. This reduction is quite minuscule and indicates the company’s overall cost structure has been relatively stable.
Earnings Per Share
We track the long-term change in earnings per share (EPS) for the same reason as long-term revenue growth. Compared to revenue, however, EPS highlights whether a company’s growth is profitable.
DXC’s full-year EPS flipped from negative to positive over the last five years. This is encouraging and shows it’s at a critical moment in its life.
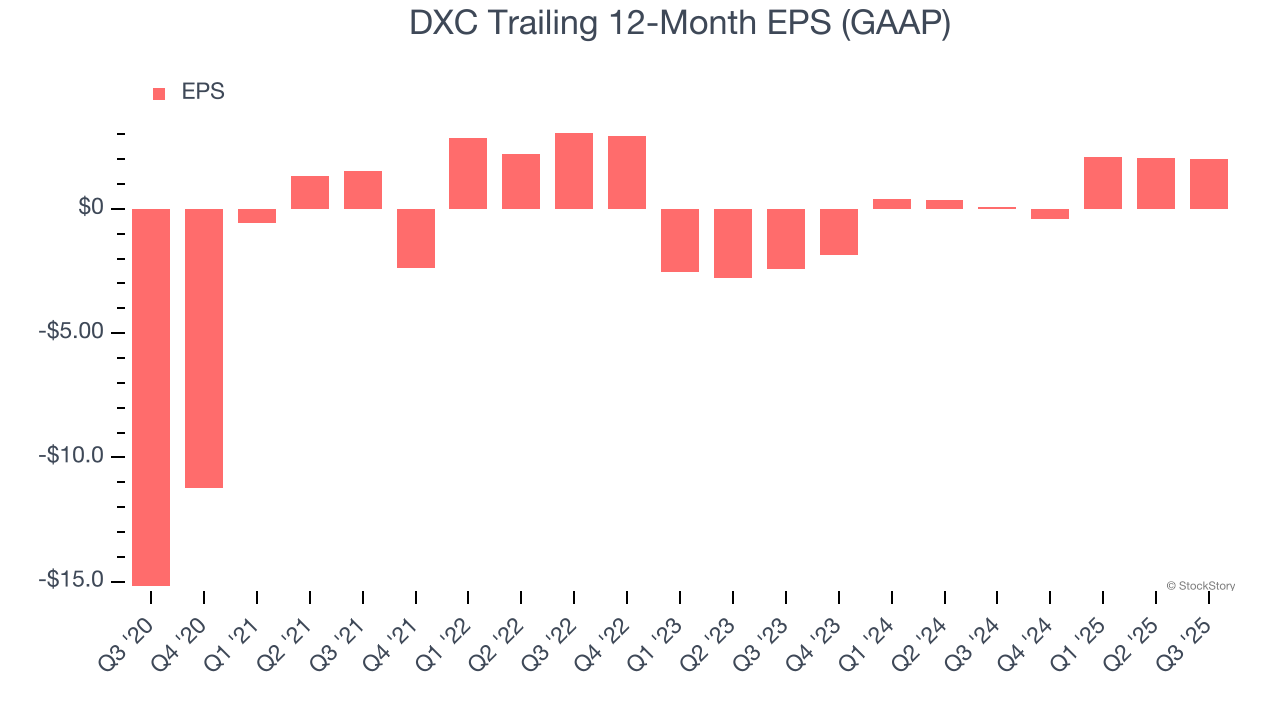
Like with revenue, we analyze EPS over a shorter period to see if we are missing a change in the business.
For DXC, its two-year annual EPS growth of 68.5% was higher than its five-year trend. We love it when earnings growth accelerates, especially when it accelerates off an already high base.
In Q3, DXC reported EPS of $0.20, down from $0.23 in the same quarter last year. This print missed analysts’ estimates, but we care more about long-term EPS growth than short-term movements. Over the next 12 months, Wall Street expects DXC’s full-year EPS of $2.02 to shrink by 36.9%.
Key Takeaways from DXC’s Q3 Results
Revenue was in line, and DXC's EPS missed Wall Street’s estimates. Overall, this quarter could have been better. The stock remained flat at $12.94 immediately after reporting.
Is DXC an attractive investment opportunity right now? We think that the latest quarter is only one piece of the longer-term business quality puzzle. Quality, when combined with valuation, can help determine if the stock is a buy. We cover that in our actionable full research report which you can read here, it’s free for active Edge members.


