
Insurance management company Erie Indemnity (NASDAQ: ERIE) missed Wall Street’s revenue expectations in Q3 CY2025, but sales rose 6.7% year on year to $1.07 billion. Its GAAP profit of $3.50 per share was 3.9% above analysts’ consensus estimates.
Is now the time to buy Erie Indemnity? Find out by accessing our full research report, it’s free for active Edge members.
Erie Indemnity (ERIE) Q3 CY2025 Highlights:
- Revenue: $1.07 billion vs analyst estimates of $1.08 billion (6.7% year-on-year growth, 1.6% miss)
- Pre-tax Profit: $232.8 million (21.8% margin, 15.9% year-on-year growth)
- EPS (GAAP): $3.50 vs analyst estimates of $3.37 (3.9% beat)
- Market Capitalization: $15.78 billion
Company Overview
Operating under a unique business model dating back to 1925, Erie Indemnity (NASDAQ: ERIE) serves as the attorney-in-fact for Erie Insurance Exchange, managing policy issuance, claims handling, and investment services for this reciprocal insurer.
Revenue Growth
Insurers earn revenue three ways. The core insurance business itself, often called underwriting and represented in the income statement as premiums earned, is one way. Investment income from investing the “float” (premiums collected upfront not yet paid out as claims) in assets such as fixed-income assets and equities is the second way. Fees from various sources such as policy administration, annuities, or other value-added services is the third. Thankfully, Erie Indemnity’s 10.1% annualized revenue growth over the last five years was solid. Its growth surpassed the average insurance company and shows its offerings resonate with customers, a great starting point for our analysis.
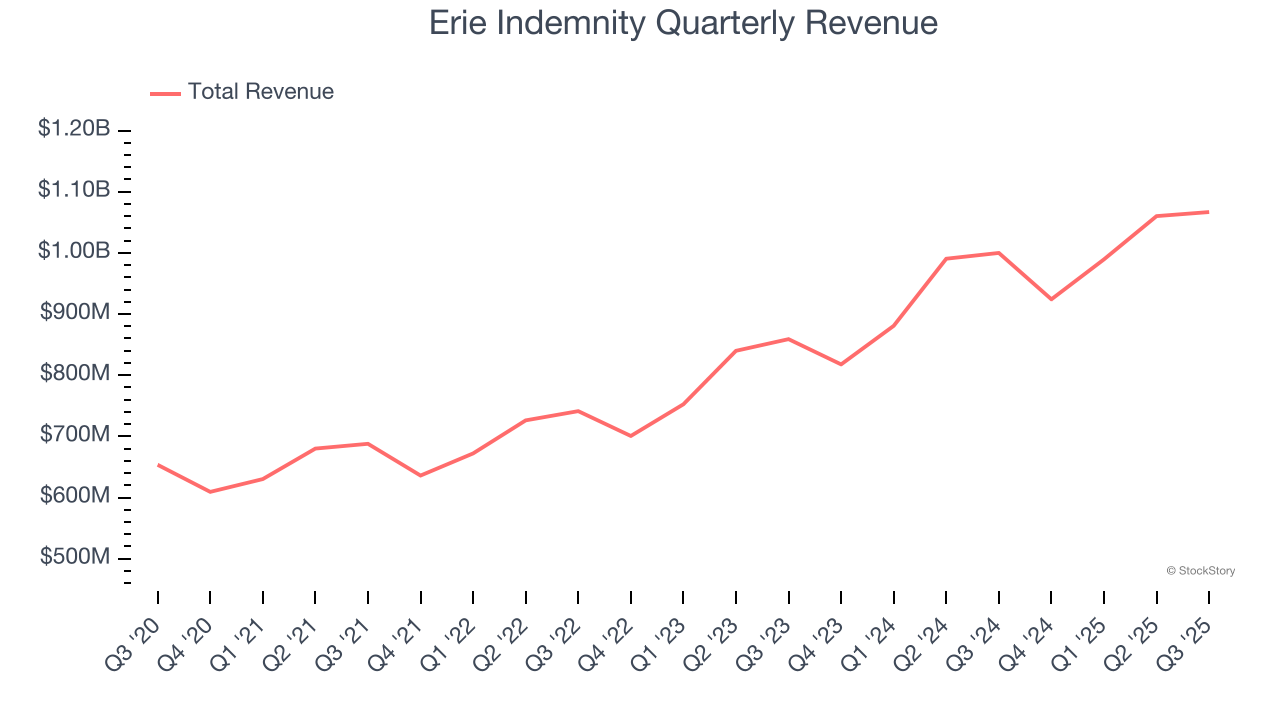
Long-term growth is the most important, but within financials, a half-decade historical view may miss recent interest rate changes and market returns. Erie Indemnity’s annualized revenue growth of 13.2% over the last two years is above its five-year trend, suggesting its demand was strong and recently accelerated. 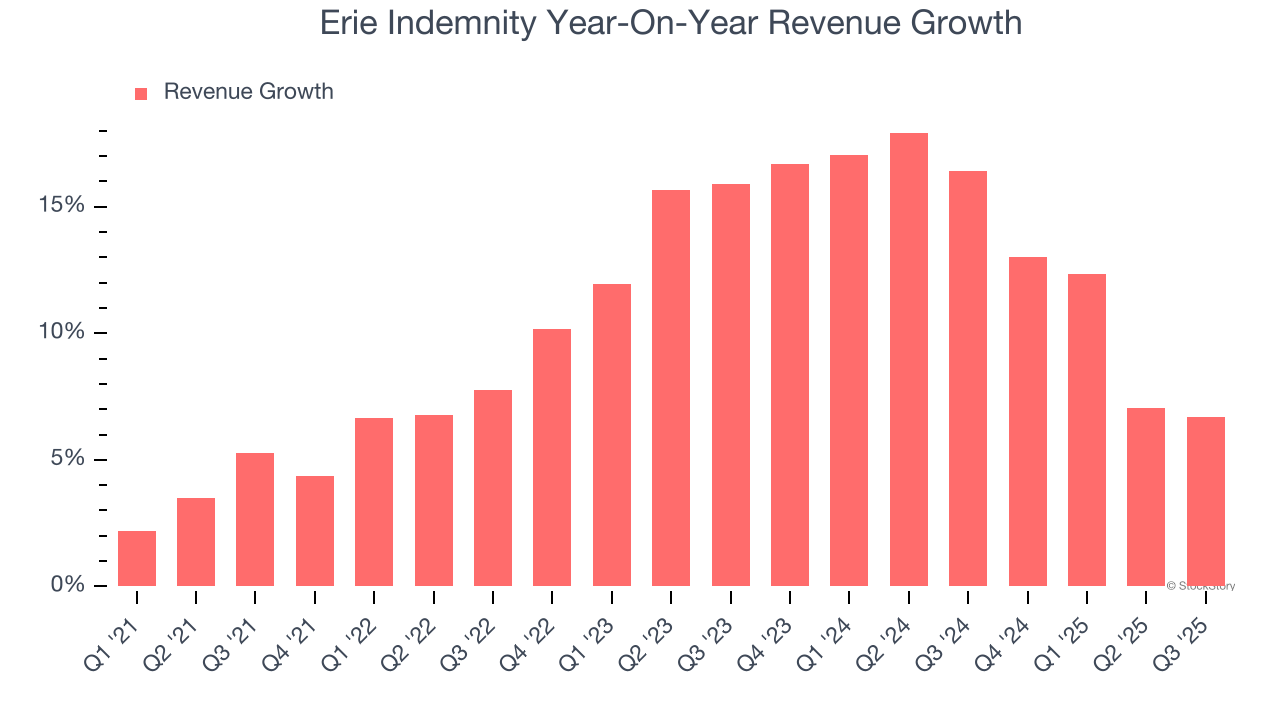
This quarter, Erie Indemnity’s revenue grew by 6.7% year on year to $1.07 billion, missing Wall Street’s estimates.
Here at StockStory, we certainly understand the potential of thematic investing. Diverse winners from Microsoft (MSFT) to Alphabet (GOOG), Coca-Cola (KO) to Monster Beverage (MNST) could all have been identified as promising growth stories with a megatrend driving the growth. So, in that spirit, we’ve identified a relatively under-the-radar profitable growth stock benefiting from the rise of AI, available to you FREE via this link.
Key Takeaways from Erie Indemnity’s Q3 Results
Revenue missed, but EPS managed to exceed expectations. Overall, this quarter was mixed. The stock remained flat at $309.64 immediately following the results.
So should you invest in Erie Indemnity right now? When making that decision, it’s important to consider its valuation, business qualities, as well as what has happened in the latest quarter. We cover that in our actionable full research report which you can read here, it’s free for active Edge members.