
Medical technology company iRhythm Technologies (NASDAQ: IRTC) beat Wall Street’s revenue expectations in Q3 CY2025, with sales up 30.7% year on year to $192.9 million. The company’s full-year revenue guidance of $737.5 million at the midpoint came in 1.5% above analysts’ estimates. Its non-GAAP loss of $0.06 per share was 78.9% above analysts’ consensus estimates.
Is now the time to buy iRhythm? Find out by accessing our full research report, it’s free for active Edge members.
iRhythm (IRTC) Q3 CY2025 Highlights:
- Revenue: $192.9 million vs analyst estimates of $184.4 million (30.7% year-on-year growth, 4.6% beat)
- Adjusted EPS: -$0.06 vs analyst estimates of -$0.28 (78.9% beat)
- Adjusted EBITDA: $21.56 million vs analyst estimates of $17.32 million (11.2% margin, 24.5% beat)
- The company lifted its revenue guidance for the full year to $737.5 million at the midpoint from $725 million, a 1.7% increase
- Market Capitalization: $5.95 billion
"iRhythm delivered another quarter of strong performance, reflecting the scalability of our platform and the growing adoption of our differentiated technology across the healthcare ecosystem," said Quentin Blackford, President and Chief Executive Officer of iRhythm.
Company Overview
Pioneering the shift from bulky, short-term heart monitors to sleek, wire-free patches, iRhythm Technologies (NASDAQ: IRTC) provides wearable cardiac monitoring devices and AI-powered analysis services that help physicians detect and diagnose heart rhythm disorders.
Revenue Growth
A company’s long-term sales performance can indicate its overall quality. Any business can put up a good quarter or two, but many enduring ones grow for years. Over the last five years, iRhythm grew its sales at an excellent 23.4% compounded annual growth rate. Its growth beat the average healthcare company and shows its offerings resonate with customers.
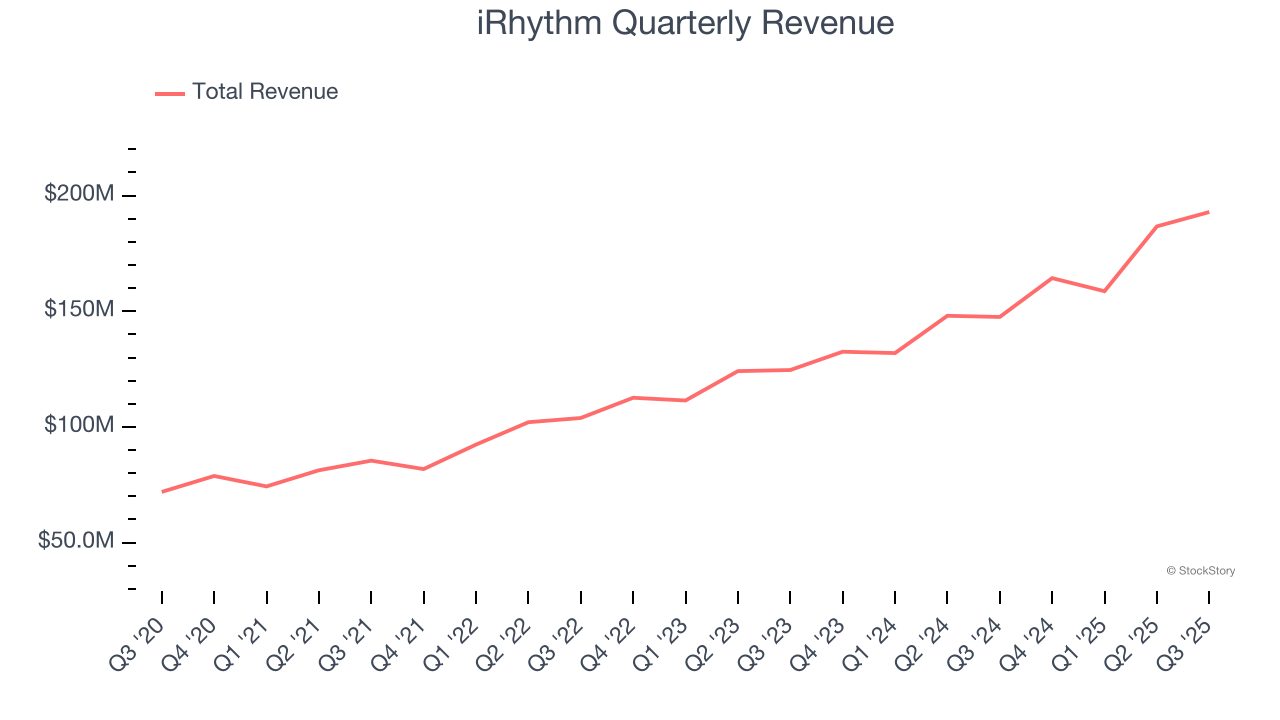
Long-term growth is the most important, but within healthcare, a half-decade historical view may miss new innovations or demand cycles. iRhythm’s annualized revenue growth of 21.9% over the last two years is below its five-year trend, but we still think the results suggest healthy demand. 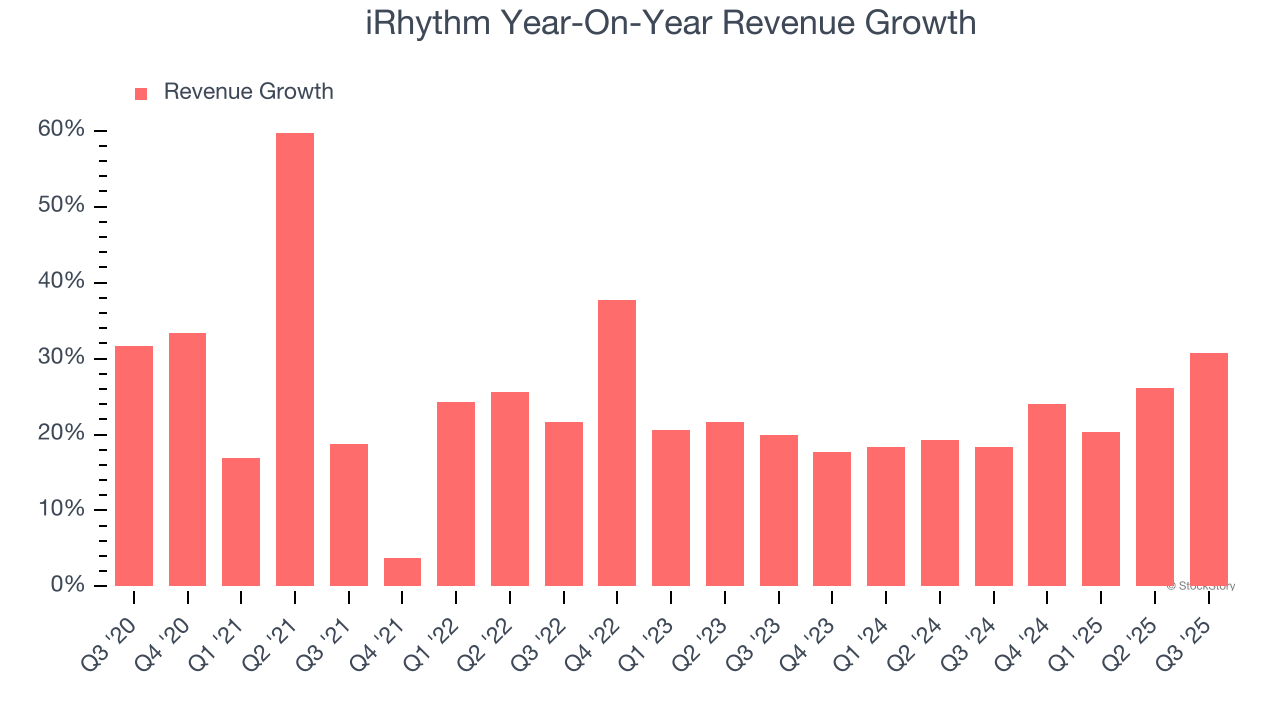
This quarter, iRhythm reported wonderful year-on-year revenue growth of 30.7%, and its $192.9 million of revenue exceeded Wall Street’s estimates by 4.6%.
Looking ahead, sell-side analysts expect revenue to grow 15.9% over the next 12 months, a deceleration versus the last two years. Still, this projection is noteworthy and suggests the market is baking in success for its products and services.
Unless you’ve been living under a rock, it should be obvious by now that generative AI is going to have a huge impact on how large corporations do business. While Nvidia and AMD are trading close to all-time highs, we prefer a lesser-known (but still profitable) stock benefiting from the rise of AI. Click here to access our free report one of our favorites growth stories.
Operating Margin
Operating margin is a key measure of profitability. Think of it as net income - the bottom line - excluding the impact of taxes and interest on debt, which are less connected to business fundamentals.
iRhythm’s high expenses have contributed to an average operating margin of negative 23% over the last five years. Unprofitable healthcare companies require extra attention because they could get caught swimming naked when the tide goes out. It’s hard to trust that the business can endure a full cycle.
On the plus side, iRhythm’s operating margin rose by 12.2 percentage points over the last five years, as its sales growth gave it operating leverage. The company’s two-year trajectory shows its performance was mostly driven by its recent improvements. These data points are very encouraging and show momentum is on its side.
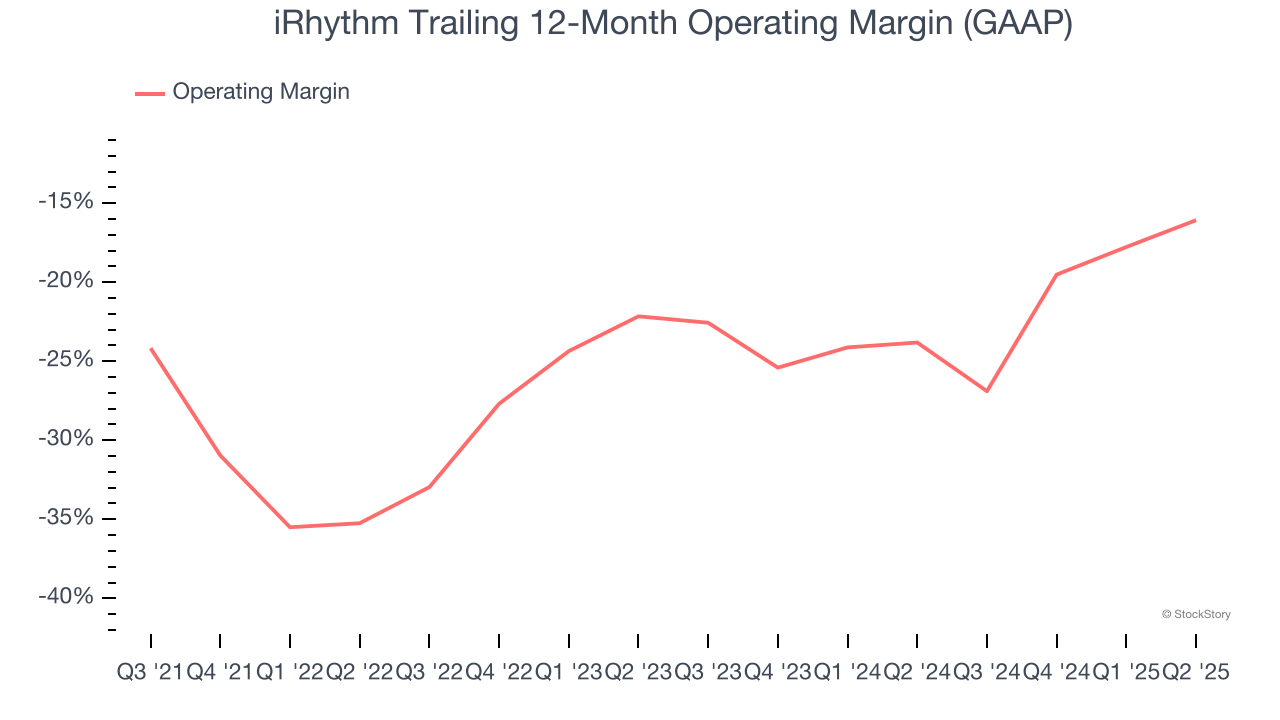
in line with the same quarter last year. This indicates the company’s overall cost structure has been relatively stable.
Earnings Per Share
We track the long-term change in earnings per share (EPS) for the same reason as long-term revenue growth. Compared to revenue, however, EPS highlights whether a company’s growth is profitable.
Although iRhythm’s full-year earnings are still negative, it reduced its losses and improved its EPS by 7% annually over the last five years. The next few quarters will be critical for assessing its long-term profitability. We hope to see an inflection point soon.
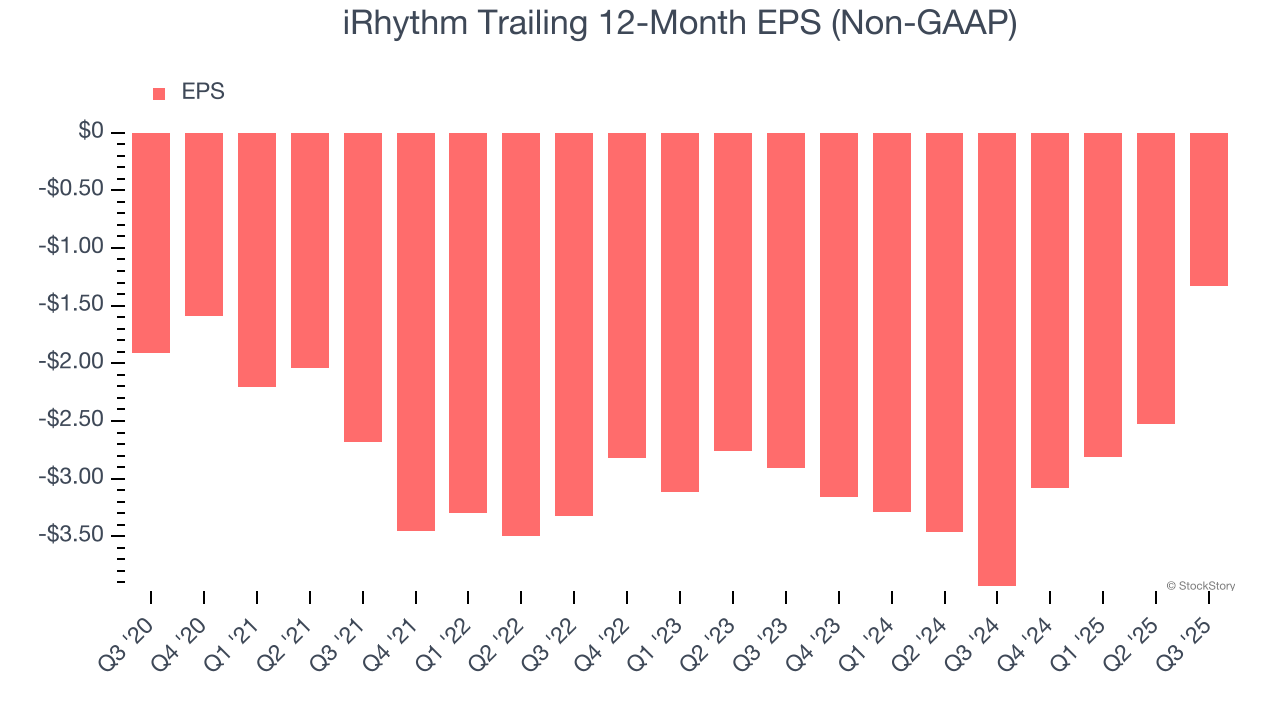
In Q3, iRhythm reported adjusted EPS of negative $0.06, up from negative $1.26 in the same quarter last year. This print easily cleared analysts’ estimates, and shareholders should be content with the results. Over the next 12 months, Wall Street expects iRhythm to improve its earnings losses. Analysts forecast its full-year EPS of negative $1.33 will advance to negative $0.69.
Key Takeaways from iRhythm’s Q3 Results
It was good to see iRhythm beat analysts’ EPS expectations this quarter. We were also glad its revenue outperformed Wall Street’s estimates. Zooming out, we think this was a solid print. The stock traded up 5.5% to $194.50 immediately following the results.
iRhythm put up rock-solid earnings, but one quarter doesn’t necessarily make the stock a buy. Let’s see if this is a good investment. What happened in the latest quarter matters, but not as much as longer-term business quality and valuation, when deciding whether to invest in this stock. We cover that in our actionable full research report which you can read here, it’s free for active Edge members.


