
Healthcare tech company Omnicell (NASDAQ: OMCL) reported Q3 CY2025 results beating Wall Street’s revenue expectations, with sales up 10% year on year to $310.6 million. On top of that, next quarter’s revenue guidance ($311 million at the midpoint) was surprisingly good and 5.2% above what analysts were expecting. Its non-GAAP profit of $0.51 per share was 40.7% above analysts’ consensus estimates.
Is now the time to buy Omnicell? Find out by accessing our full research report, it’s free for active Edge members.
Omnicell (OMCL) Q3 CY2025 Highlights:
- Revenue: $310.6 million vs analyst estimates of $295.8 million (10% year-on-year growth, 5% beat)
- Adjusted EPS: $0.51 vs analyst estimates of $0.36 (40.7% beat)
- Adjusted EBITDA: $41.13 million vs analyst estimates of $31.75 million (13.2% margin, 29.5% beat)
- Revenue Guidance for Q4 CY2025 is $311 million at the midpoint, above analyst estimates of $295.5 million
- Management raised its full-year Adjusted EPS guidance to $1.68 at the midpoint, a 10.2% increase
- EBITDA guidance for the full year is $143 million at the midpoint, above analyst estimates of $133.9 million
- Operating Margin: 2.7%, in line with the same quarter last year
- Free Cash Flow Margin: 4.5%, similar to the same quarter last year
- Market Capitalization: $1.36 billion
“We are pleased with the strong financial performance delivered in the third quarter, with total revenues, non-GAAP EBITDA and non-GAAP EPS all exceeding the upper end of our previously issued guidance,” stated Randall Lipps, chairman, president, chief executive officer, and founder of Omnicell.
Company Overview
Driven by the vision of an "Autonomous Pharmacy" with zero medication errors, Omnicell (NASDAQ: OMCL) provides medication management automation and adherence tools that help healthcare systems and pharmacies reduce errors and improve efficiency.
Revenue Growth
A company’s long-term sales performance can indicate its overall quality. Even a bad business can shine for one or two quarters, but a top-tier one grows for years. Unfortunately, Omnicell’s 5.7% annualized revenue growth over the last five years was mediocre. This fell short of our benchmark for the healthcare sector and is a rough starting point for our analysis.
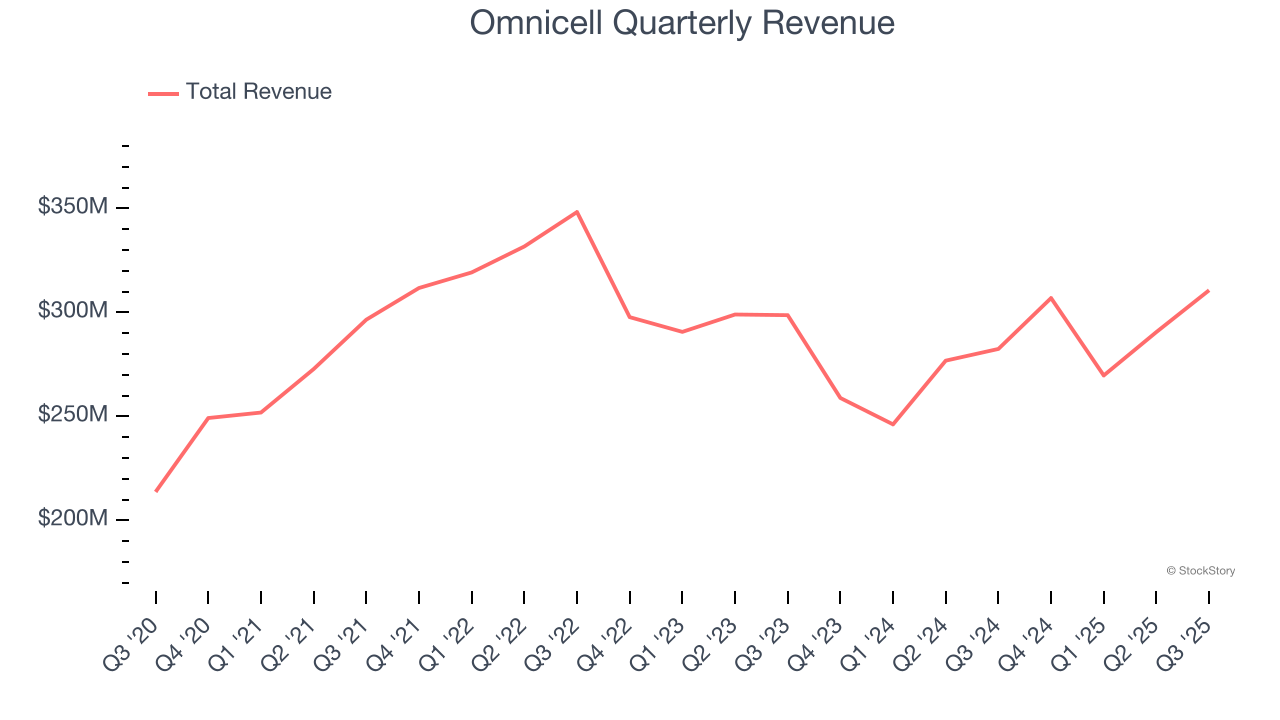
We at StockStory place the most emphasis on long-term growth, but within healthcare, a half-decade historical view may miss recent innovations or disruptive industry trends. Omnicell’s recent performance shows its demand has slowed as its revenue was flat over the last two years. 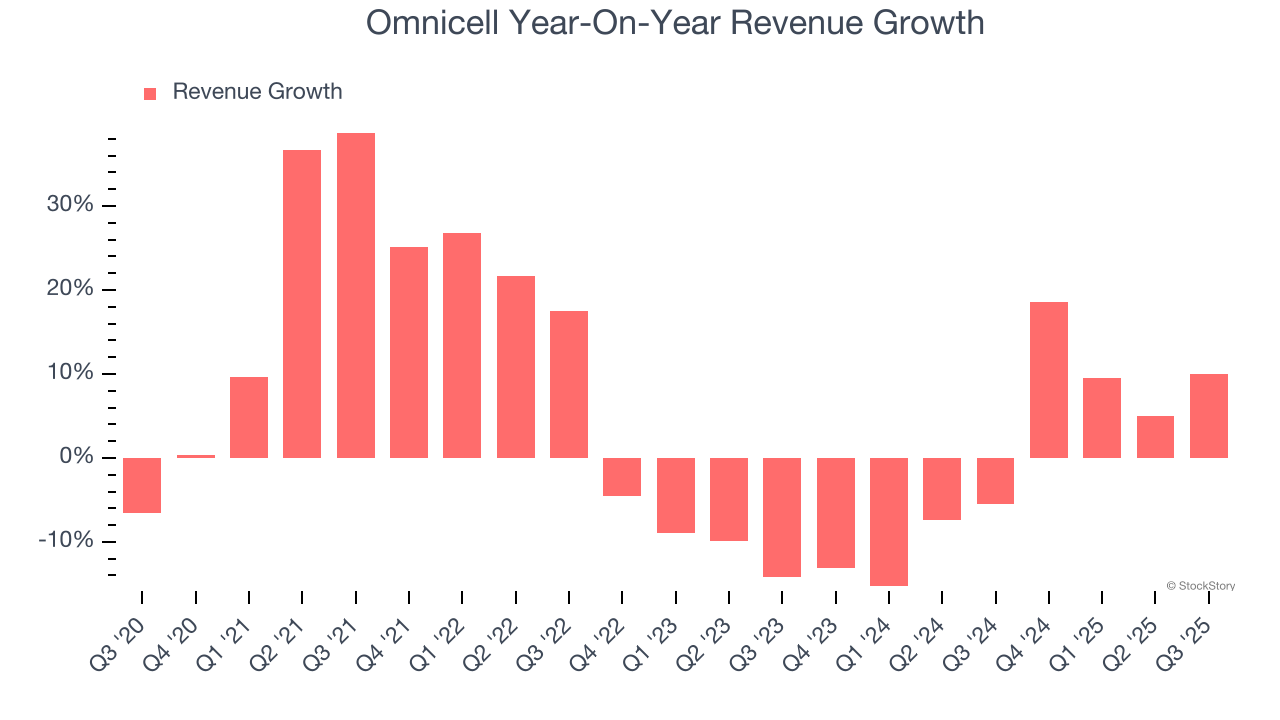
Omnicell also breaks out the revenue for its most important segment, Product. Over the last two years, Omnicell’s Product revenue averaged 4.6% year-on-year declines. This segment has lagged the company’s overall sales. 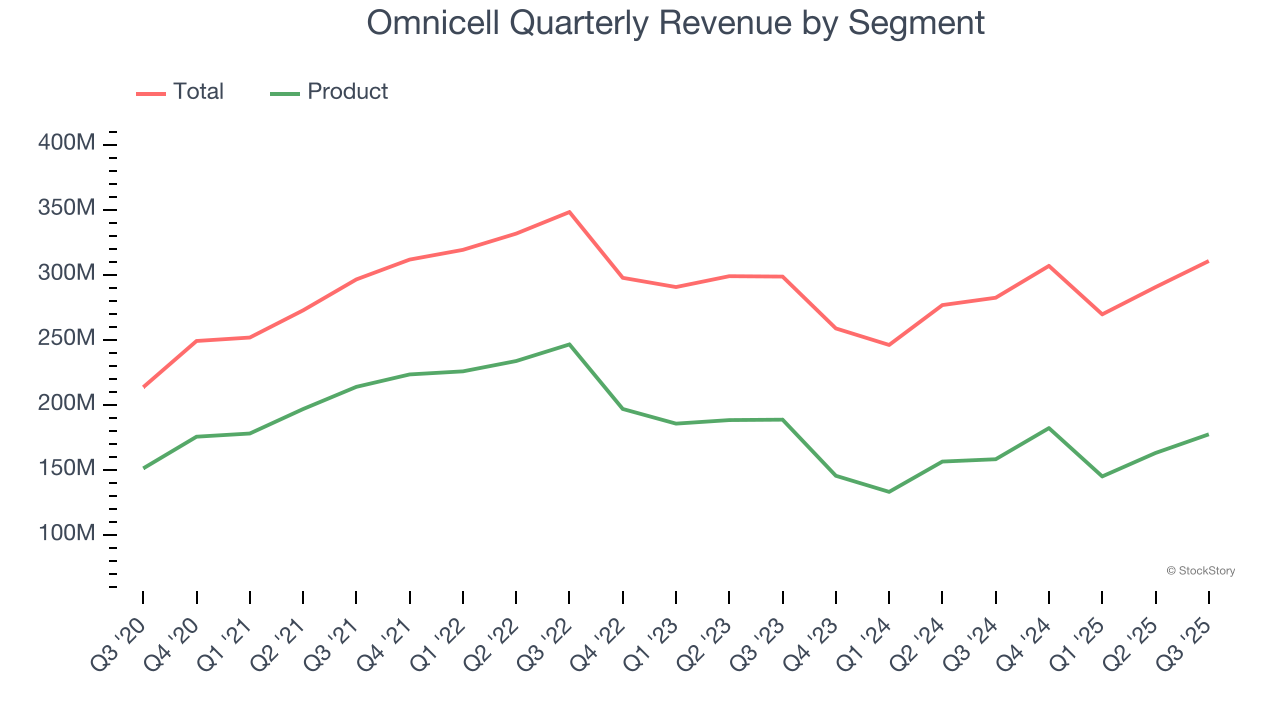
This quarter, Omnicell reported year-on-year revenue growth of 10%, and its $310.6 million of revenue exceeded Wall Street’s estimates by 5%. Company management is currently guiding for a 1.3% year-on-year increase in sales next quarter.
Looking further ahead, sell-side analysts expect revenue to remain flat over the next 12 months. This projection is underwhelming and indicates its newer products and services will not lead to better top-line performance yet.
Today’s young investors won’t have read the timeless lessons in Gorilla Game: Picking Winners In High Technology because it was written more than 20 years ago when Microsoft and Apple were first establishing their supremacy. But if we apply the same principles, then enterprise software stocks leveraging their own generative AI capabilities may well be the Gorillas of the future. So, in that spirit, we are excited to present our Special Free Report on a profitable, fast-growing enterprise software stock that is already riding the automation wave and looking to catch the generative AI next.
Operating Margin
Operating margin is an important measure of profitability as it shows the portion of revenue left after accounting for all core expenses – everything from the cost of goods sold to advertising and wages. It’s also useful for comparing profitability across companies with different levels of debt and tax rates because it excludes interest and taxes.
Omnicell was profitable over the last five years but held back by its large cost base. Its average operating margin of 1.3% was weak for a healthcare business.
Analyzing the trend in its profitability, Omnicell’s operating margin decreased by 7.7 percentage points over the last five years, but it rose by 5.7 percentage points on a two-year basis. Still, shareholders will want to see Omnicell become more profitable in the future.
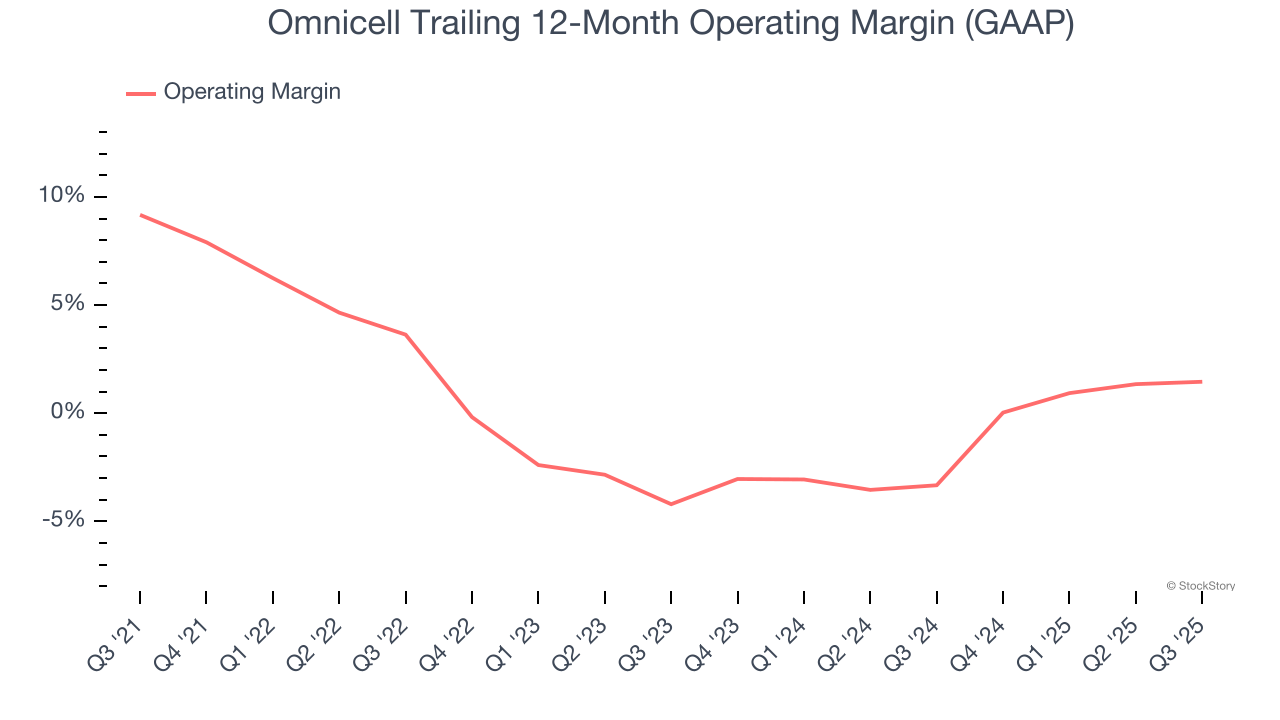
In Q3, Omnicell generated an operating margin profit margin of 2.7%, in line with the same quarter last year. This indicates the company’s overall cost structure has been relatively stable.
Earnings Per Share
We track the long-term change in earnings per share (EPS) for the same reason as long-term revenue growth. Compared to revenue, however, EPS highlights whether a company’s growth is profitable.
Sadly for Omnicell, its EPS declined by 5.4% annually over the last five years while its revenue grew by 5.7%. This tells us the company became less profitable on a per-share basis as it expanded.
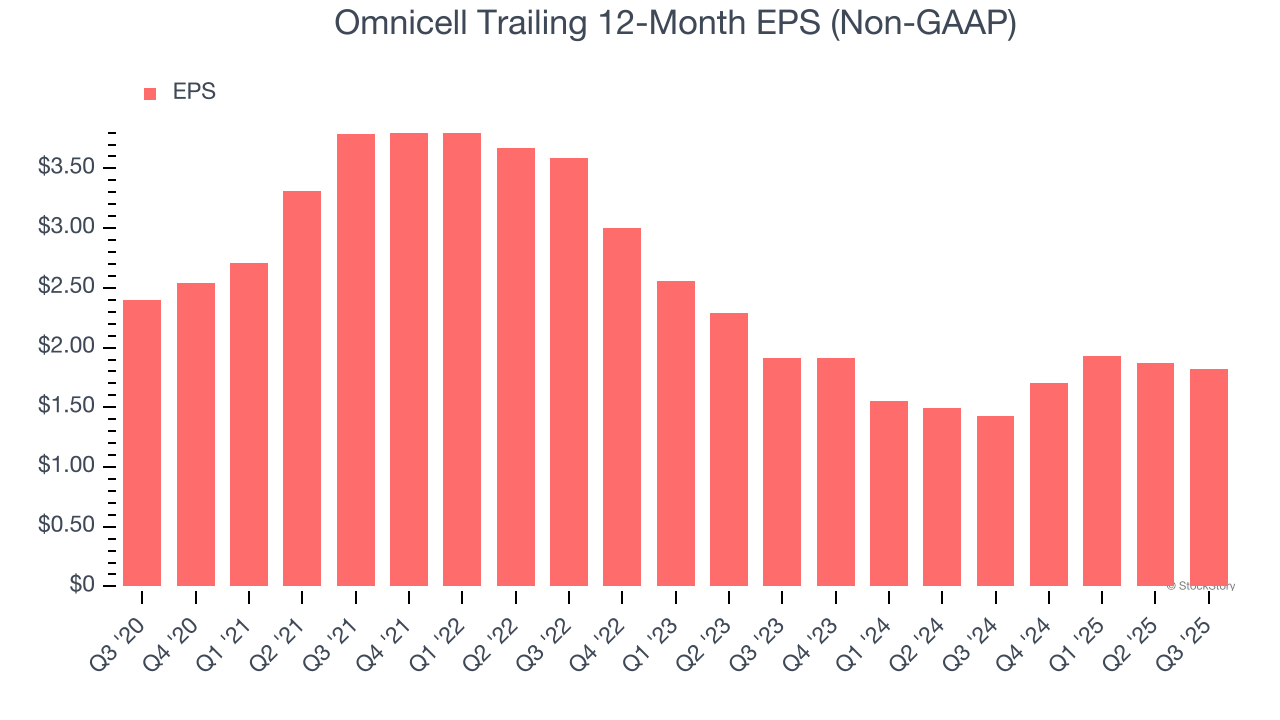
We can take a deeper look into Omnicell’s earnings to better understand the drivers of its performance. As we mentioned earlier, Omnicell’s operating margin was flat this quarter but declined by 7.7 percentage points over the last five years. Its share count also grew by 5.1%, meaning the company not only became less efficient with its operating expenses but also diluted its shareholders. 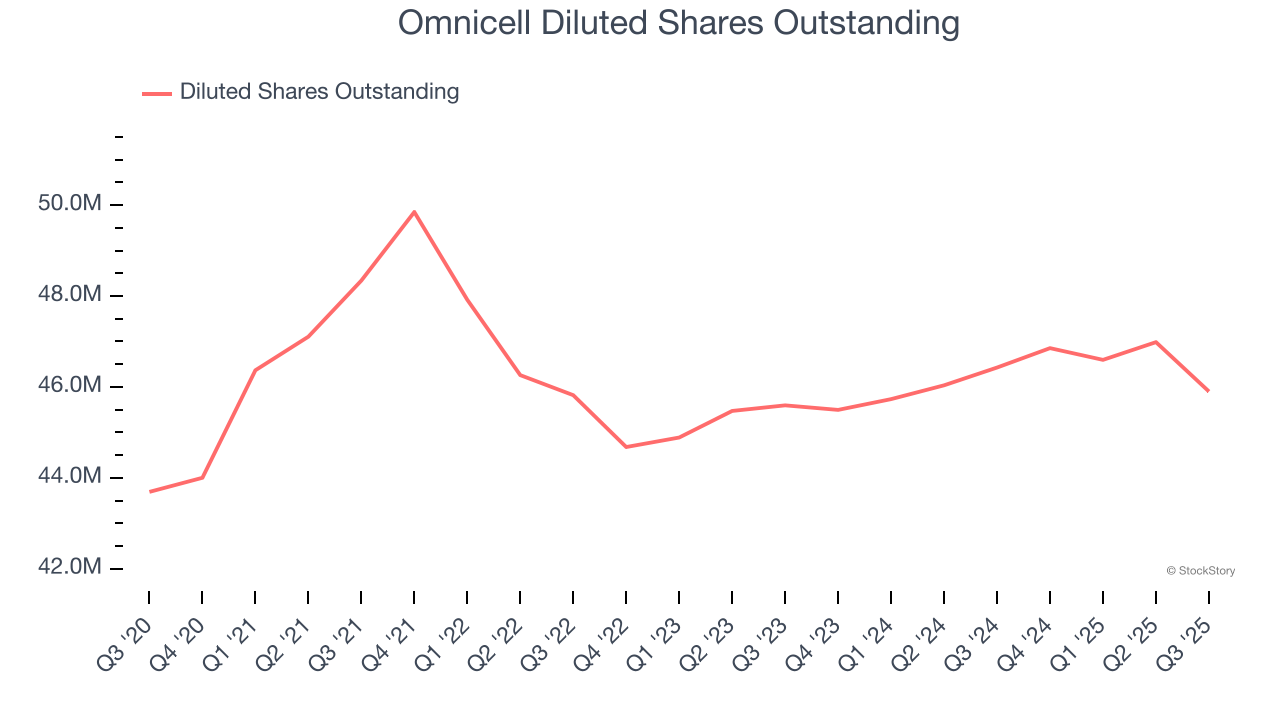
In Q3, Omnicell reported adjusted EPS of $0.51, down from $0.56 in the same quarter last year. Despite falling year on year, this print easily cleared analysts’ estimates. Over the next 12 months, Wall Street expects Omnicell’s full-year EPS of $1.82 to shrink by 9.2%.
Key Takeaways from Omnicell’s Q3 Results
It was good to see Omnicell beat analysts’ EPS expectations this quarter. We were also excited its revenue outperformed Wall Street’s estimates by a wide margin. On the other hand, its EPS guidance for next quarter missed and its EBITDA guidance for next quarter fell slightly short of Wall Street’s estimates. Zooming out, we think this quarter featured some important positives. The stock traded up 8.3% to $32 immediately after reporting.
Omnicell may have had a good quarter, but does that mean you should invest right now? When making that decision, it’s important to consider its valuation, business qualities, as well as what has happened in the latest quarter. We cover that in our actionable full research report which you can read here, it’s free for active Edge members.