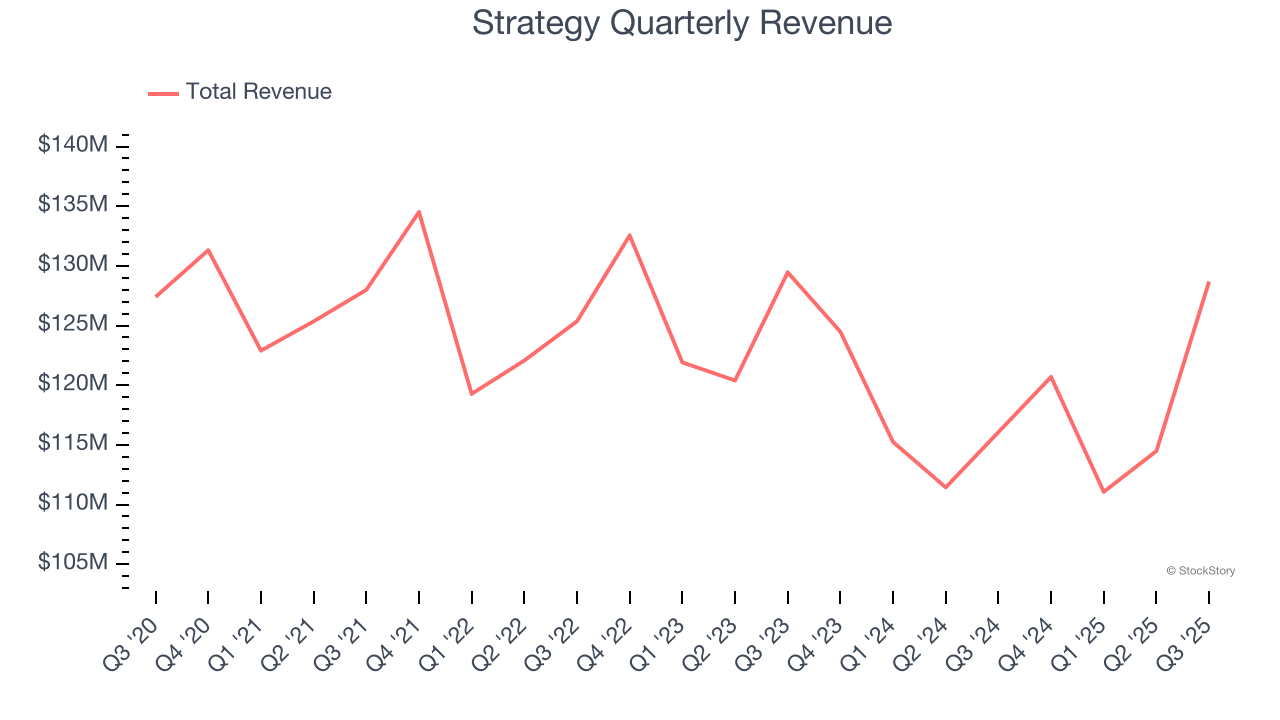
Bitcoin development company Strategy (NASDAQ: MSTR) reported Q3 CY2025 results exceeding the market’s revenue expectations, with sales up 10.9% year on year to $128.7 million. Its GAAP profit of $8.42 per share was 12.9% below analysts’ consensus estimates.
Is now the time to buy Strategy? Find out by accessing our full research report, it’s free for active Edge members.
Strategy (MSTR) Q3 CY2025 Highlights:
- Holds 640,808 bitcoins at a total cost of $47.44 billion, or $74,032 per bitcoin (up 1.9% from last quarter's 628,791 bitcoins at an average cost basis $73,277)
- Revenue: $128.7 million vs analyst estimates of $118 million (10.9% year-on-year growth, 9.1% beat)
- EPS (GAAP): $8.42 vs analyst expectations of $9.67 (12.9% miss)
- EPS (GAAP) guidance for the full year is $80 at the midpoint, beating analyst estimates by 89.2%
- Operating Margin: 3,023%, up from -373% in the same quarter last year
- Free Cash Flow was -$45.61 million compared to -$53.01 million in the previous quarter
- Market Capitalization: $78.98 billion
Company Overview
Once a traditional business intelligence software provider, Strategy (NASDAQ: MSTR) develops AI-powered enterprise analytics software while also functioning as a major corporate holder of Bitcoin cryptocurrency.
Note that our analysis is rooted in fundamentals, not Bitcoin-driven technicals.
Revenue Growth
Examining a company’s long-term performance can provide clues about its quality. Any business can experience short-term success, but top-performing ones enjoy sustained growth for years. Unfortunately, Strategy struggled to consistently increase demand as its $474.9 million of sales for the trailing 12 months was close to its revenue five years ago. This was below our standards and suggests it’s a low quality business.
Long-term growth is the most important, but within software, a half-decade historical view may miss new innovations or demand cycles. Strategy’s recent performance shows its demand remained suppressed as its revenue has declined by 3% annually over the last two years. 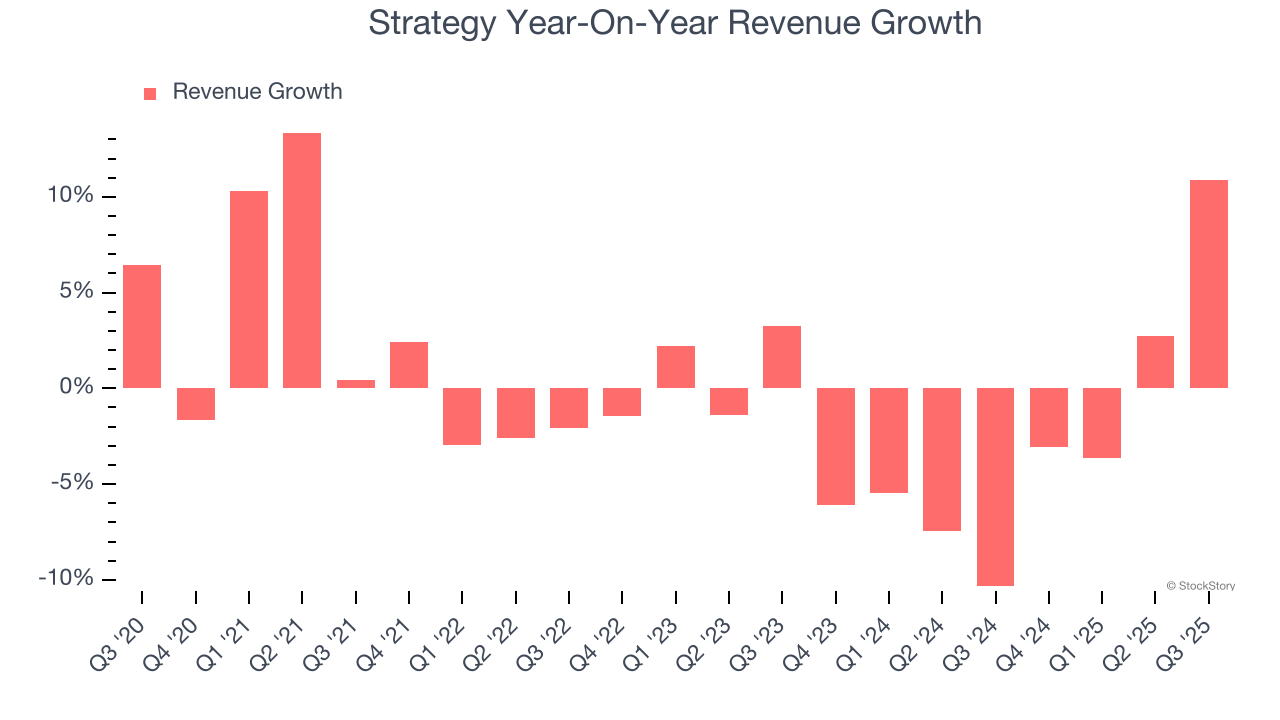
This quarter, Strategy reported year-on-year revenue growth of 10.9%, and its $128.7 million of revenue exceeded Wall Street’s estimates by 9.1%.
Looking ahead, sell-side analysts expect revenue to grow 2.6% over the next 12 months. Although this projection suggests its newer products and services will fuel better top-line performance, it is still below average for the sector.
Unless you’ve been living under a rock, it should be obvious by now that generative AI is going to have a huge impact on how large corporations do business. While Nvidia and AMD are trading close to all-time highs, we prefer a lesser-known (but still profitable) stock benefiting from the rise of AI. Click here to access our free report one of our favorites growth stories.
Cash Is King
If you’ve followed StockStory for a while, you know we emphasize free cash flow. Why, you ask? We believe that in the end, cash is king, and you can’t use accounting profits to pay the bills.
Strategy’s demanding reinvestments have drained its resources over the last year, putting it in a pinch and limiting its ability to return capital to investors. Its free cash flow margin averaged negative 29%, meaning it lit $29.03 of cash on fire for every $100 in revenue. This is a stark contrast from its operating margin, and its investments (i.e., stocking inventory, building new facilities) are the primary culprit.
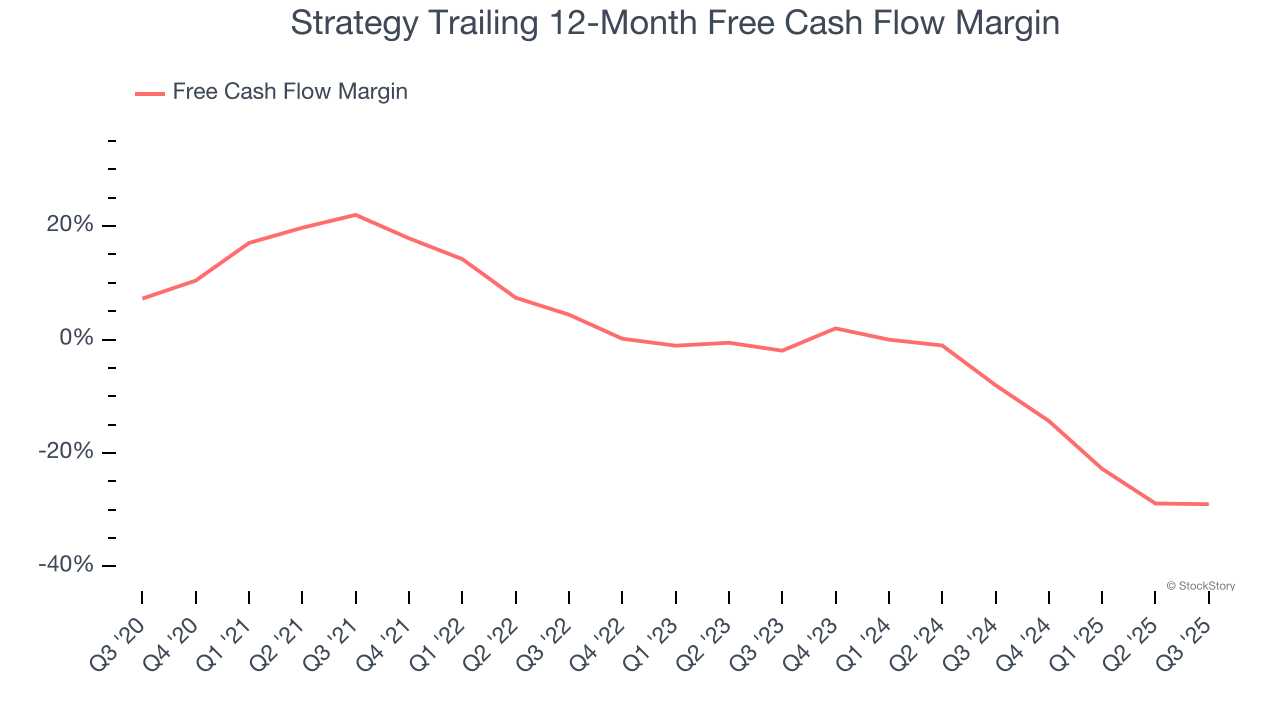
Strategy burned through $45.61 million of cash in Q3, equivalent to a negative 35.4% margin. The company’s cash burn was similar to its $41.39 million of lost cash in the same quarter last year.
Key Takeaways from Strategy’s Q3 Results
We were impressed by Strategy’s optimistic full-year EPS guidance, which blew past analysts’ expectations. We were also glad its revenue and EPS outperformed Wall Street’s estimates. Zooming out, we think this quarter featured some important positives. The stock traded up 2.6% to $260.76 immediately following the results.
Strategy had an encouraging quarter, but one earnings result doesn’t necessarily make the stock a buy. Let’s see if this is a good investment. We think that the latest quarter is only one piece of the longer-term business quality puzzle. Quality, when combined with valuation, can help determine if the stock is a buy. We cover that in our actionable full research report which you can read here, it’s free for active Edge members.