Semi trailers and liquid transportation container manufacturer Wabash (NYSE: WNC) met Wall Streets revenue expectations in Q3 CY2025, but sales fell by 17.8% year on year to $381.6 million. On the other hand, the company’s full-year revenue guidance of $1.5 billion at the midpoint came in 5.1% below analysts’ estimates. Its non-GAAP loss of $0.51 per share was 31.5% below analysts’ consensus estimates.
Is now the time to buy Wabash? Find out by accessing our full research report, it’s free for active Edge members.
Wabash (WNC) Q3 CY2025 Highlights:
- Revenue: $381.6 million vs analyst estimates of $381.5 million (17.8% year-on-year decline, in line)
- Adjusted EPS: -$0.51 vs analyst expectations of -$0.39 (31.5% miss)
- Adjusted EBITDA: -$5.48 million vs analyst estimates of -$3 million (-1.4% margin, 82.5% miss)
- The company dropped its revenue guidance for the full year to $1.5 billion at the midpoint from $1.6 billion, a 6.3% decrease
- Management lowered its full-year Adjusted EPS guidance to -$2 at the midpoint, a 73.9% decrease
- Operating Margin: 15.1%, up from -93.3% in the same quarter last year
- Free Cash Flow Margin: 15.9%, up from 5.8% in the same quarter last year
- Backlog: $829 million at quarter end, down 17.1% year on year
- Market Capitalization: $340.2 million
Company Overview
With its first trailer reportedly built on two sawhorses, Wabash (NYSE: WNC) offers semi trailers, liquid transportation containers, truck bodies, and equipment for moving goods.
Revenue Growth
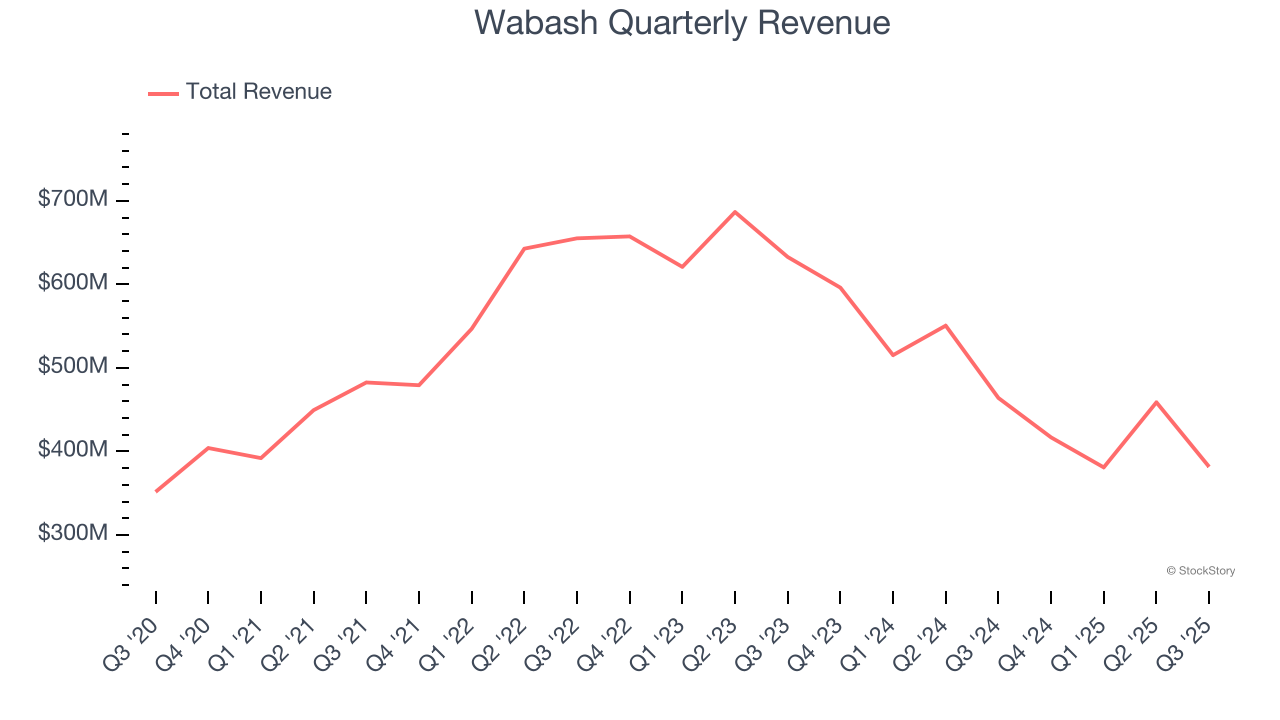
A company’s long-term performance is an indicator of its overall quality. Any business can put up a good quarter or two, but many enduring ones grow for years. Unfortunately, Wabash struggled to consistently increase demand as its $1.64 billion of sales for the trailing 12 months was close to its revenue five years ago. This was below our standards and is a sign of poor business quality.
We at StockStory place the most emphasis on long-term growth, but within industrials, a half-decade historical view may miss cycles, industry trends, or a company capitalizing on catalysts such as a new contract win or a successful product line. Wabash’s recent performance shows its demand remained suppressed as its revenue has declined by 20.6% annually over the last two years. Wabash isn’t alone in its struggles as the Heavy Transportation Equipment industry experienced a cyclical downturn, with many similar businesses observing lower sales at this time. 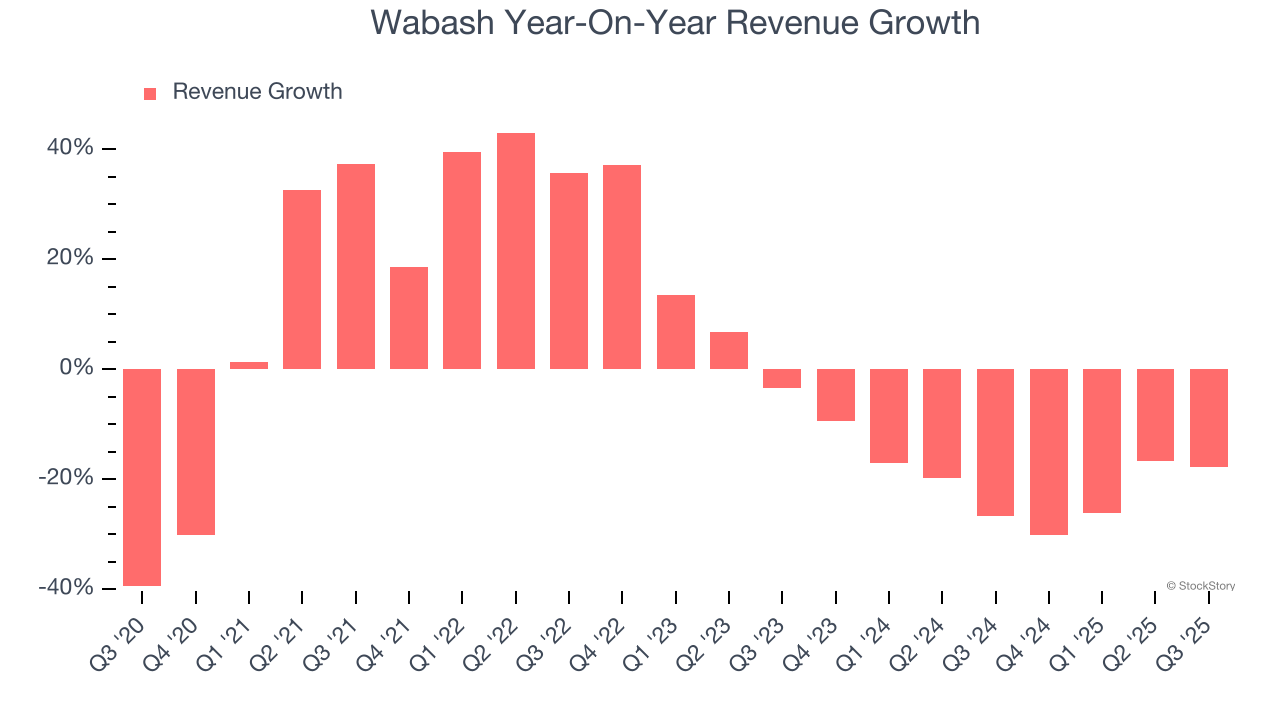
Wabash also reports its backlog, or the value of its outstanding orders that have not yet been executed or delivered. Wabash’s backlog reached $829 million in the latest quarter and averaged 36.2% year-on-year declines over the last two years. Because this number is lower than its revenue growth, we can see the company hasn’t secured enough new orders to maintain its growth rate in the future. 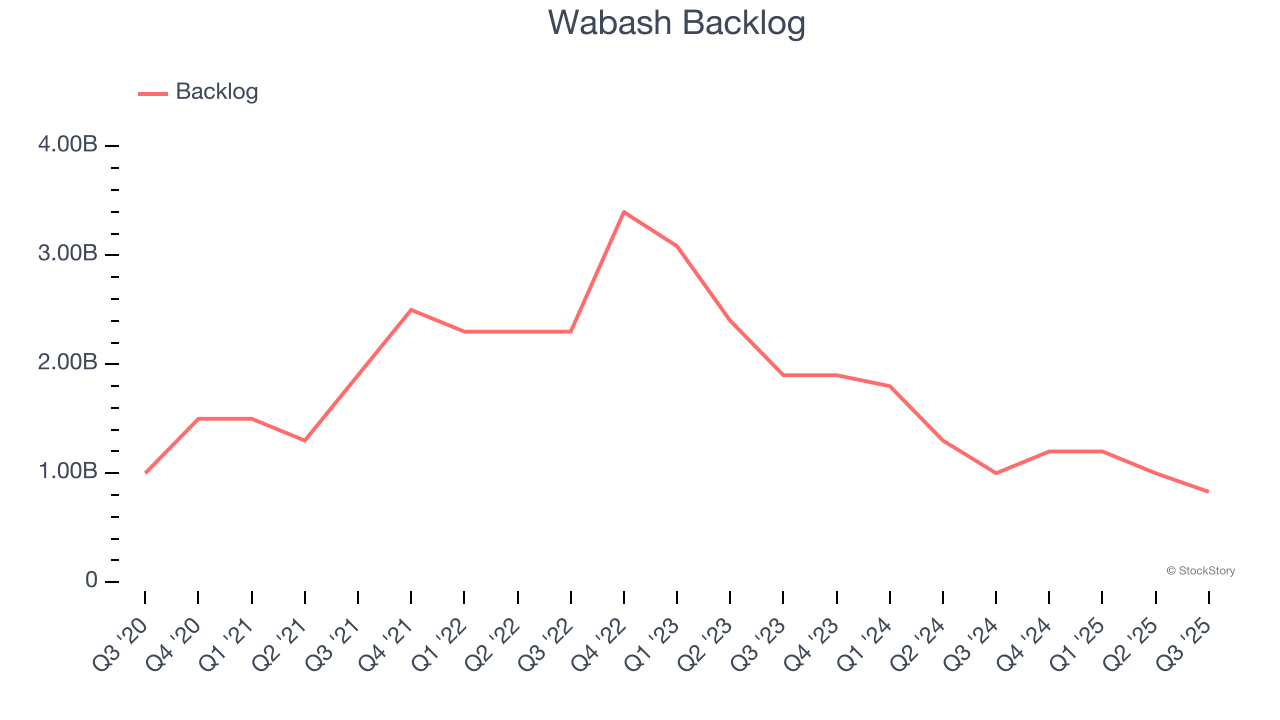
This quarter, Wabash reported a rather uninspiring 17.8% year-on-year revenue decline to $381.6 million of revenue, in line with Wall Street’s estimates.
Looking ahead, sell-side analysts expect revenue to grow 1.4% over the next 12 months. Although this projection indicates its newer products and services will spur better top-line performance, it is still below the sector average.
Unless you’ve been living under a rock, it should be obvious by now that generative AI is going to have a huge impact on how large corporations do business. While Nvidia and AMD are trading close to all-time highs, we prefer a lesser-known (but still profitable) stock benefiting from the rise of AI. Click here to access our free report one of our favorites growth stories.
Operating Margin
Operating margin is a key measure of profitability. Think of it as net income - the bottom line - excluding the impact of taxes and interest on debt, which are less connected to business fundamentals.
Wabash was profitable over the last five years but held back by its large cost base. Its average operating margin of 5.1% was weak for an industrials business. This result isn’t too surprising given its low gross margin as a starting point.
On the plus side, Wabash’s operating margin rose by 19.1 percentage points over the last five years.
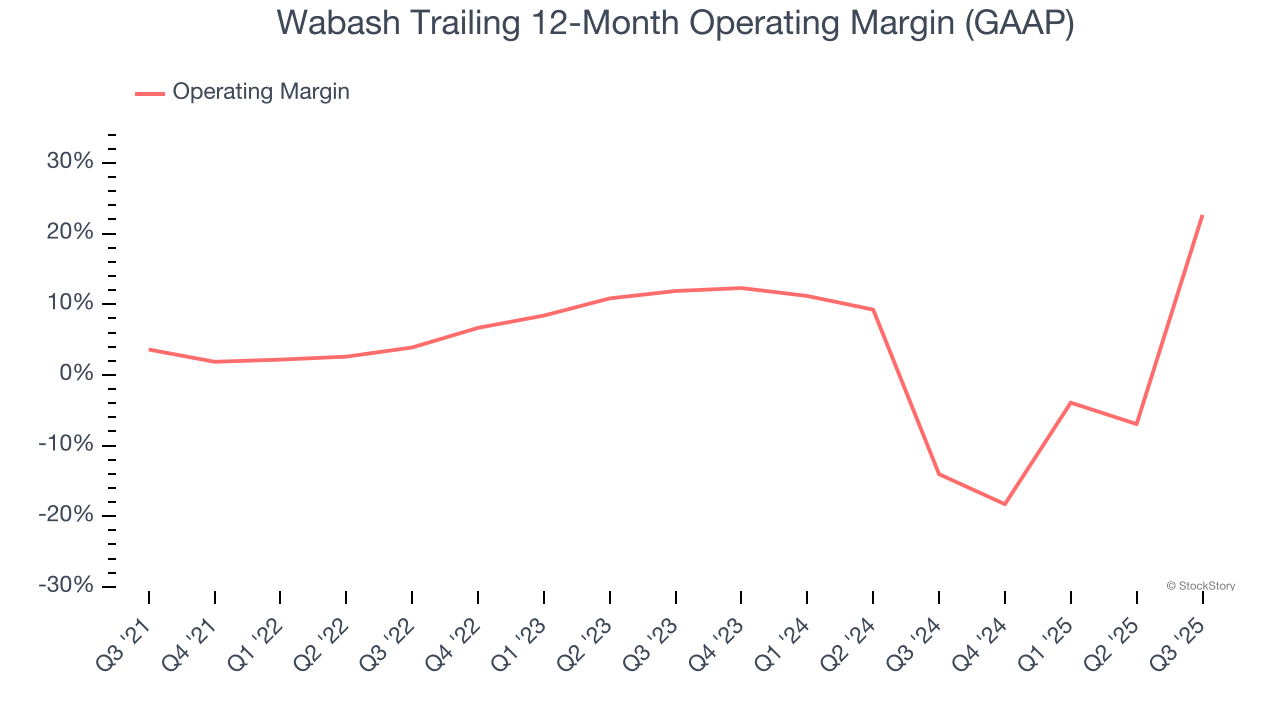
In Q3, Wabash generated an operating margin profit margin of 15.1%, up 108.4 percentage points year on year. The increase was solid, and because its revenue and gross margin actually decreased, we can assume it was more efficient because it trimmed its operating expenses like marketing, R&D, and administrative overhead.
Earnings Per Share
We track the long-term change in earnings per share (EPS) for the same reason as long-term revenue growth. Compared to revenue, however, EPS highlights whether a company’s growth is profitable.
Sadly for Wabash, its EPS declined by 39.2% annually over the last five years while its revenue was flat. We can see the difference stemmed from higher interest expenses or taxes as the company actually improved its operating margin and repurchased its shares during this time.
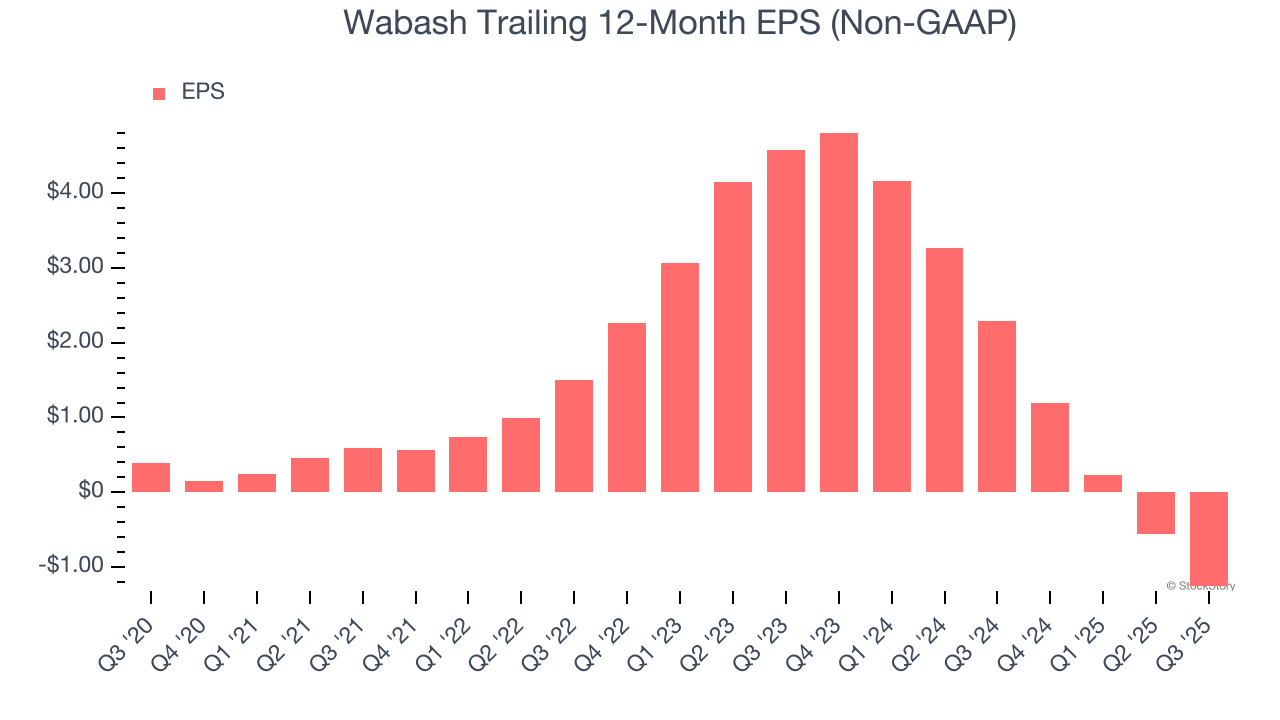
Like with revenue, we analyze EPS over a shorter period to see if we are missing a change in the business.
For Wabash, its two-year annual EPS declines of 50.8% show it’s continued to underperform. These results were bad no matter how you slice the data.
In Q3, Wabash reported adjusted EPS of negative $0.51, down from $0.19 in the same quarter last year. This print missed analysts’ estimates. Over the next 12 months, Wall Street is optimistic. Analysts forecast Wabash’s full-year EPS of negative $1.26 will flip to positive $0.17.
Key Takeaways from Wabash’s Q3 Results
We struggled to find many positives in these results. Wabash's EPS missed. Additionally, its full-year revenue guidance missed and its full-year EPS guidance fell short of Wall Street’s estimates after both were lowered. Overall, this was a weaker quarter. The stock traded down 7% to $7.72 immediately following the results.
Wabash may have had a tough quarter, but does that actually create an opportunity to invest right now? The latest quarter does matter, but not nearly as much as longer-term fundamentals and valuation, when deciding if the stock is a buy. We cover that in our actionable full research report which you can read here, it’s free for active Edge members.