Online real estate marketplace Zillow (NASDAQ: ZG) reported Q3 CY2025 results exceeding the market’s revenue expectations, with sales up 16.4% year on year to $676 million. Guidance for next quarter’s revenue was better than expected at $650 million at the midpoint, 0.9% above analysts’ estimates. Its GAAP profit of $0.04 per share was $0.01 above analysts’ consensus estimates.
Is now the time to buy Zillow? Find out by accessing our full research report, it’s free for active Edge members.
Zillow (ZG) Q3 CY2025 Highlights:
- Revenue: $676 million vs analyst estimates of $670.5 million (16.4% year-on-year growth, 0.8% beat)
- EPS (GAAP): $0.04 vs analyst estimates of $0.03 ($0.01 beat)
- Adjusted EBITDA: $165 million vs analyst estimates of $158.4 million (24.4% margin, 4.2% beat)
- Revenue Guidance for Q4 CY2025 is $650 million at the midpoint, above analyst estimates of $643.9 million
- EBITDA guidance for Q4 CY2025 is $150 million at the midpoint, in line with analyst expectations
- Operating Margin: -0.4%, up from -7.7% in the same quarter last year
- Market Capitalization: $17.18 billion
Company Overview
Founded by Expedia co-founders Lloyd Frink and Rich Barton, Zillow (NASDAQ: ZG) is the leading U.S. online real estate marketplace.
Revenue Growth
A company’s long-term sales performance is one signal of its overall quality. Any business can put up a good quarter or two, but the best consistently grow over the long haul. Zillow struggled to consistently generate demand over the last five years as its sales dropped at a 6.6% annual rate. This was below our standards and suggests it’s a low quality business.
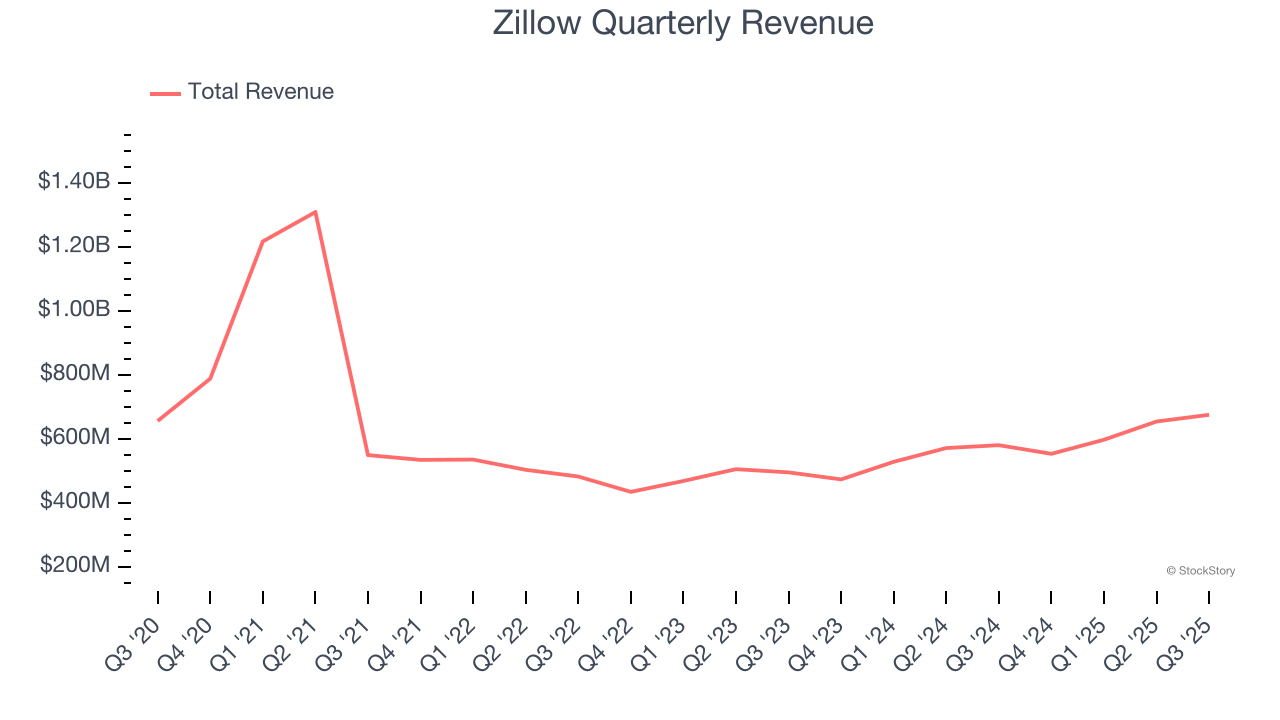
We at StockStory place the most emphasis on long-term growth, but within consumer discretionary, a stretched historical view may miss a company riding a successful new product or trend. Zillow’s annualized revenue growth of 14.1% over the last two years is above its five-year trend, but we were still disappointed by the results. 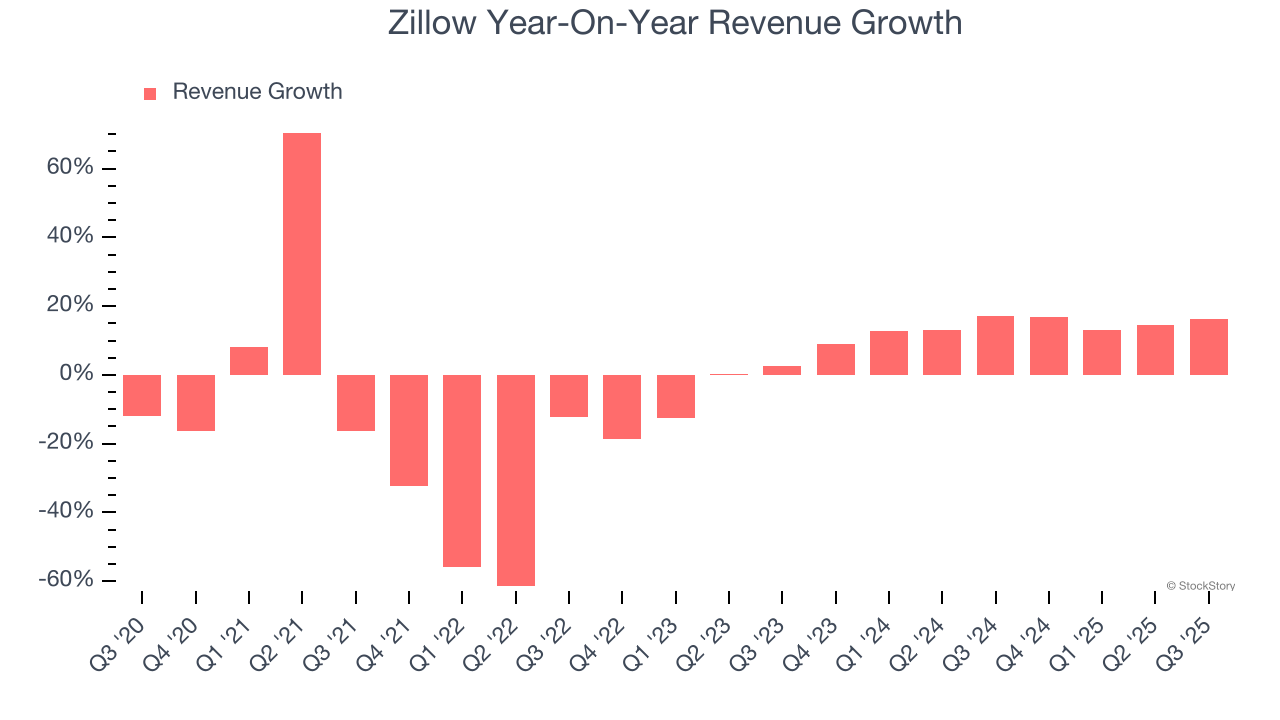
This quarter, Zillow reported year-on-year revenue growth of 16.4%, and its $676 million of revenue exceeded Wall Street’s estimates by 0.8%. Company management is currently guiding for a 17.3% year-on-year increase in sales next quarter.
Looking further ahead, sell-side analysts expect revenue to grow 14.9% over the next 12 months, similar to its two-year rate. This projection is above average for the sector and indicates its newer products and services will help sustain its recent top-line performance.
Unless you’ve been living under a rock, it should be obvious by now that generative AI is going to have a huge impact on how large corporations do business. While Nvidia and AMD are trading close to all-time highs, we prefer a lesser-known (but still profitable) stock benefiting from the rise of AI. Click here to access our free report one of our favorites growth stories.
Operating Margin
Operating margin is a key measure of profitability. Think of it as net income - the bottom line - excluding the impact of taxes and interest on debt, which are less connected to business fundamentals.
Zillow’s operating margin has risen over the last 12 months, but it still averaged negative 7% over the last two years. This is due to its large expense base and inefficient cost structure.
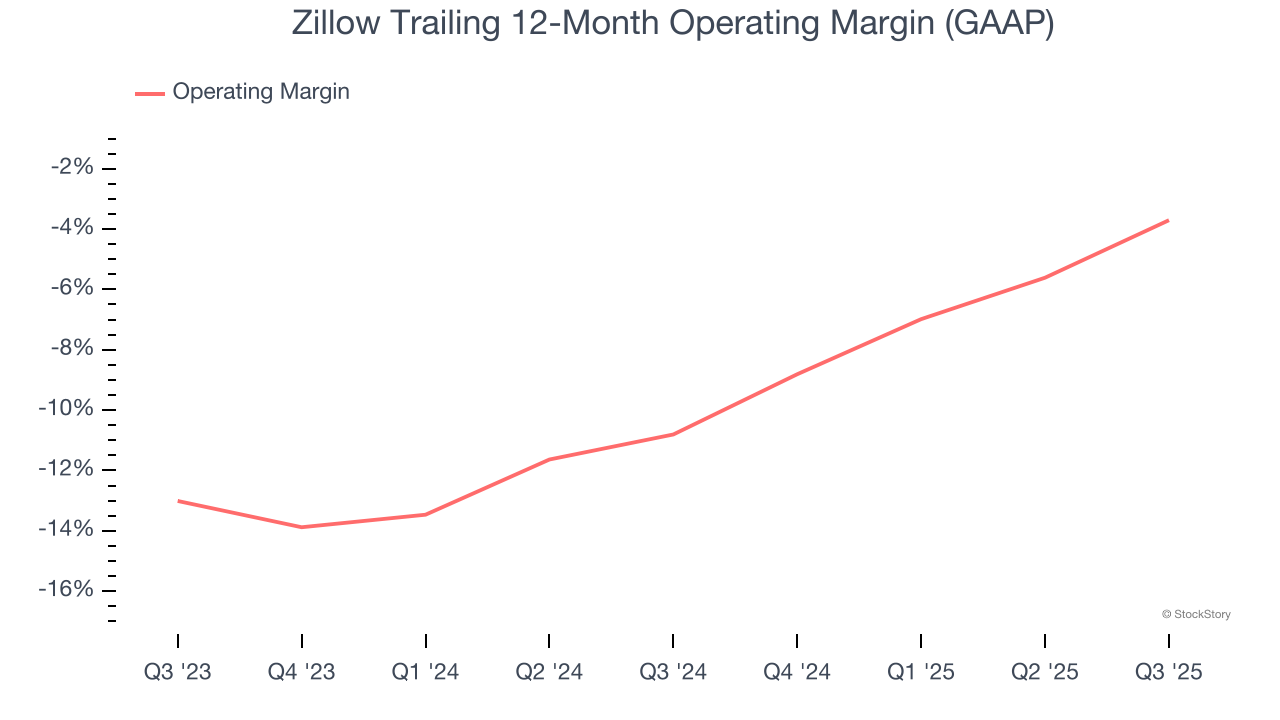
This quarter, Zillow generated a negative 0.4% operating margin. The company's consistent lack of profits raise a flag.
Earnings Per Share
We track the long-term change in earnings per share (EPS) for the same reason as long-term revenue growth. Compared to revenue, however, EPS highlights whether a company’s growth is profitable.
Although Zillow’s full-year earnings are still negative, it reduced its losses and improved its EPS by 37.8% annually over the last five years. The next few quarters will be critical for assessing its long-term profitability.
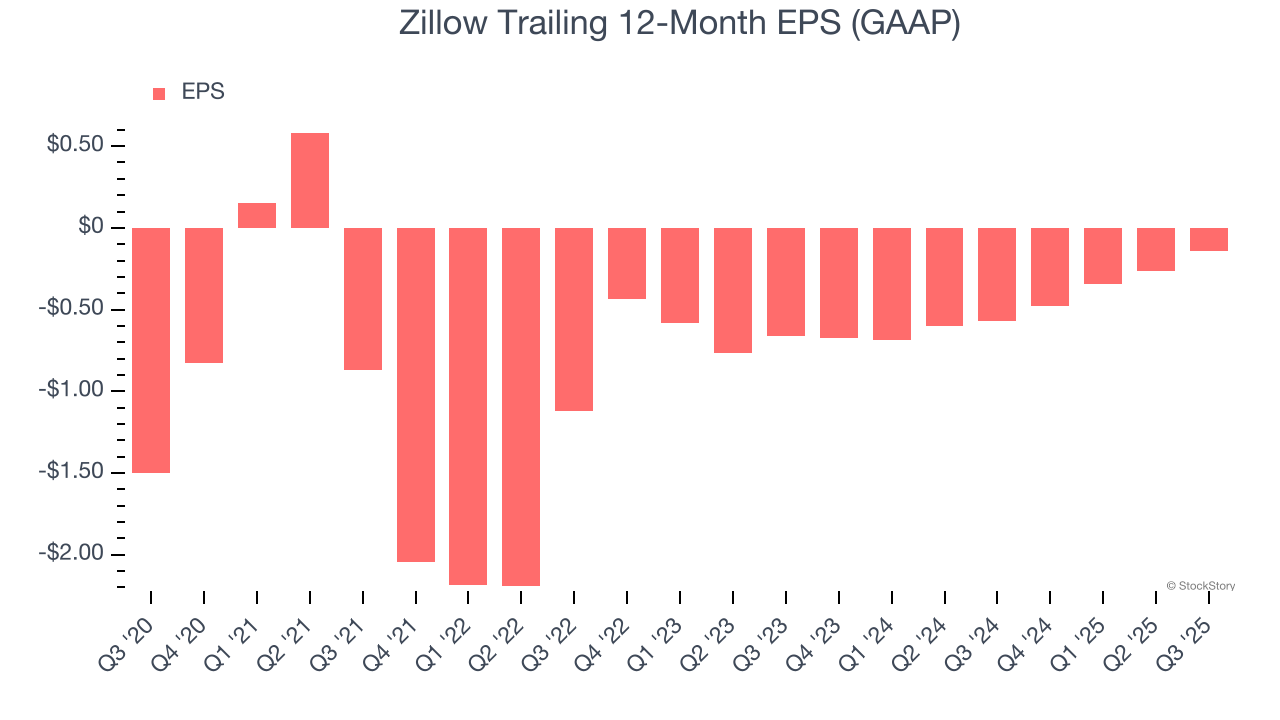
In Q3, Zillow reported EPS of $0.04, up from negative $0.09 in the same quarter last year. This print easily cleared analysts’ estimates, and shareholders should be content with the results. Over the next 12 months, Wall Street is optimistic. Analysts forecast Zillow’s full-year EPS of negative $0.14 will flip to positive $0.45.
Key Takeaways from Zillow’s Q3 Results
It was good to see Zillow beat analysts’ EPS expectations this quarter. We were also glad its revenue guidance for next quarter slightly exceeded Wall Street’s estimates. Overall, this print had some key positives. The stock traded up 3.8% to $71.42 immediately after reporting.
Zillow put up rock-solid earnings, but one quarter doesn’t necessarily make the stock a buy. Let’s see if this is a good investment. We think that the latest quarter is only one piece of the longer-term business quality puzzle. Quality, when combined with valuation, can help determine if the stock is a buy. We cover that in our actionable full research report which you can read here, it’s free for active Edge members.


