
Even though Monster (currently trading at $65.28 per share) has gained 8.6% over the last six months, it has lagged the S&P 500’s 22.6% return during that period. This might have investors contemplating their next move.
Taking into account the weaker price action, does MNST warrant a spot on your radar, or is it better left off your list? Find out in our full research report, it’s free for active Edge members.
Why Are We Positive On MNST?
Founded in 2002 as a natural soda and juice company, Monster Beverage (NASDAQ: MNST) is a pioneer of the energy drink category, and its Monster Energy brand targets a young, active demographic.
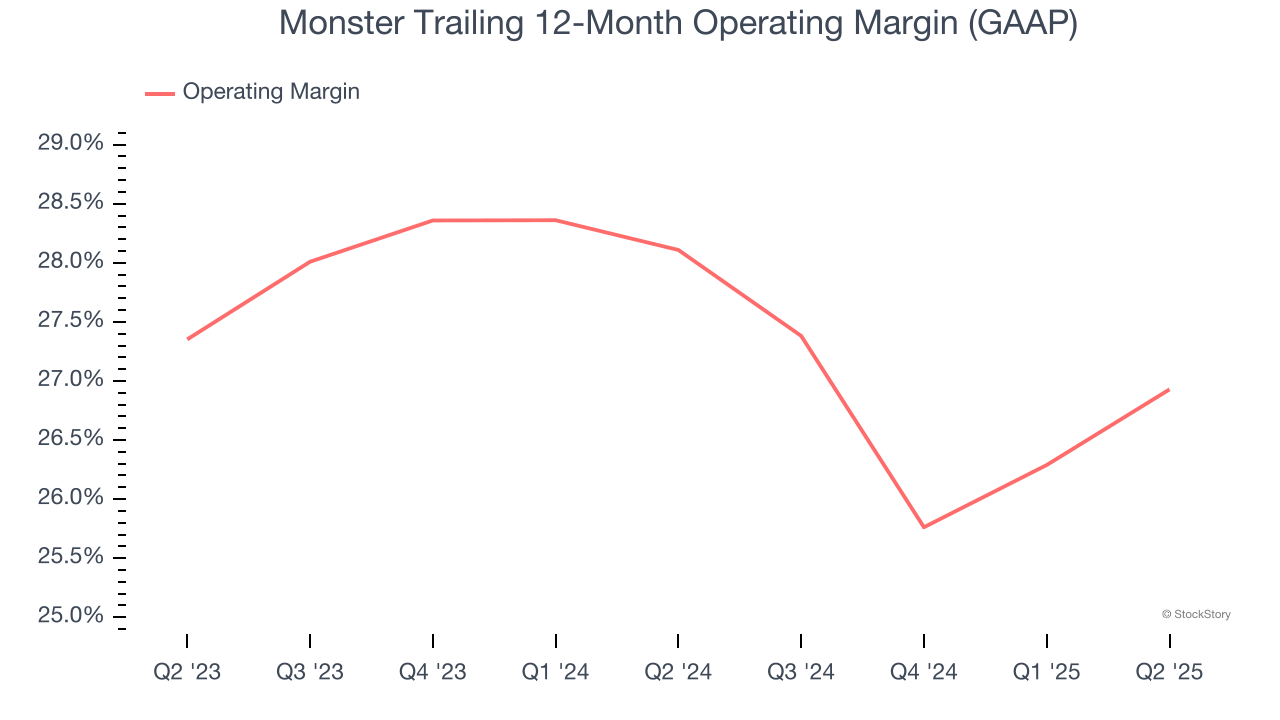
1. Operating Margin Reveals a Well-Run Organization
Operating margin is an important measure of profitability accounting for key expenses such as marketing and advertising, IT systems, wages, and other administrative costs.
Monster has been a well-oiled machine over the last two years. It demonstrated elite profitability for a consumer staples business, boasting an average operating margin of 27.5%. This result isn’t surprising as its high gross margin gives it a favorable starting point.
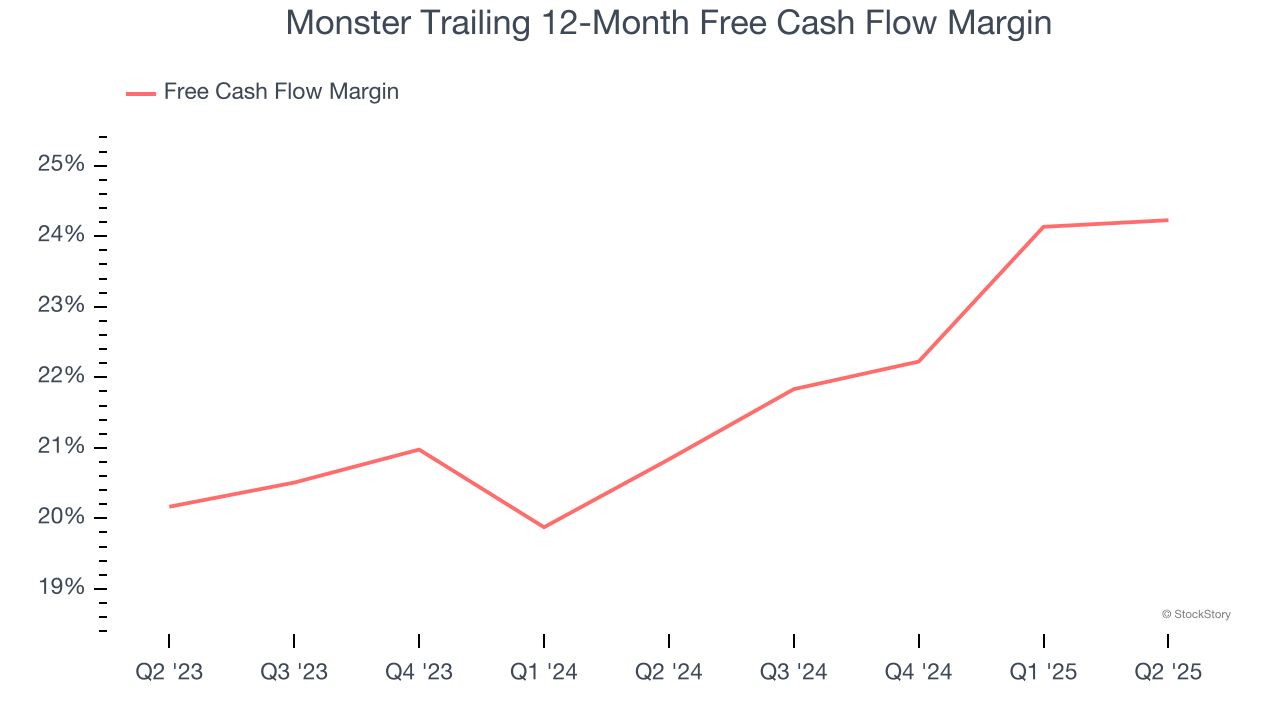
2. Excellent Free Cash Flow Margin Boosts Reinvestment Potential
If you’ve followed StockStory for a while, you know we emphasize free cash flow. Why, you ask? We believe that in the end, cash is king, and you can’t use accounting profits to pay the bills.
Monster has shown terrific cash profitability, driven by its lucrative business model that enables it to reinvest, return capital to investors, and stay ahead of the competition. The company’s free cash flow margin was among the best in the consumer staples sector, averaging 22.6% over the last two years.
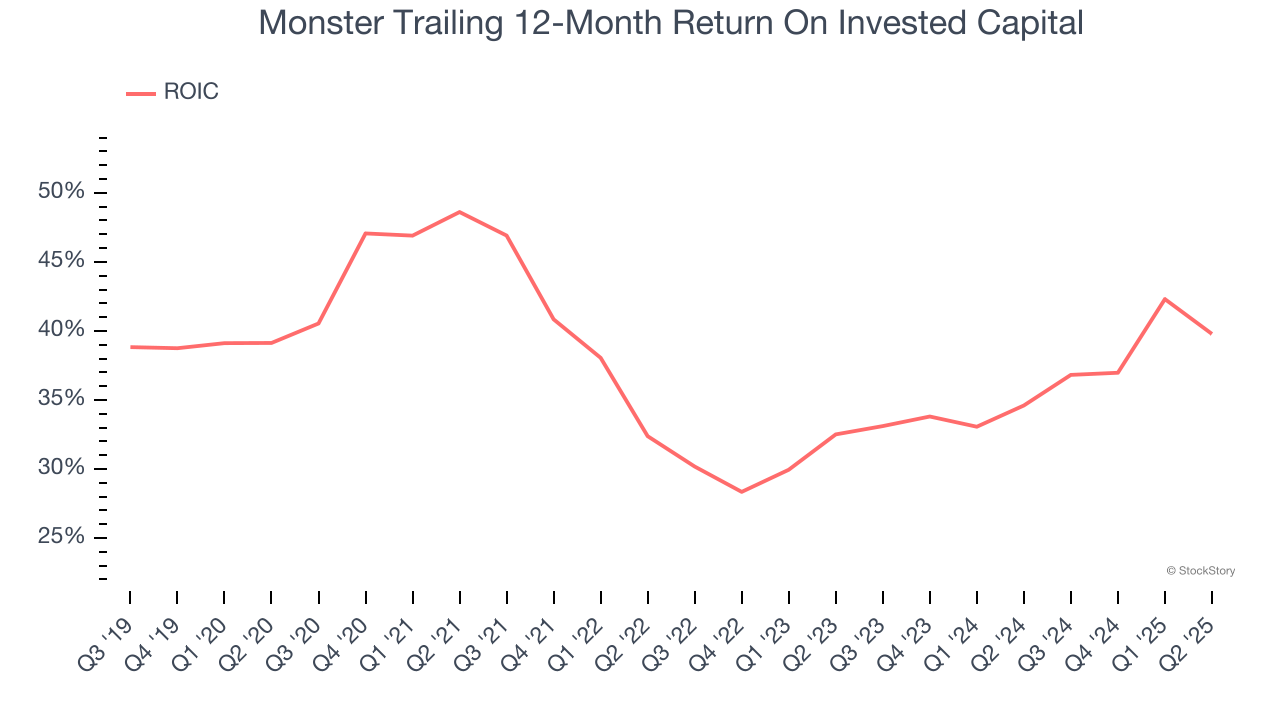
3. Stellar ROIC Showcases Lucrative Growth Opportunities
Growth gives us insight into a company’s long-term potential, but how capital-efficient was that growth? A company’s ROIC explains this by showing how much operating profit it makes compared to the money it has raised (debt and equity).
Monster’s five-year average ROIC was 37.6%, placing it among the best consumer staples companies. This illustrates its management team’s ability to invest in highly profitable ventures and produce tangible results for shareholders.
Final Judgment
These are just a few reasons Monster is a high-quality business worth owning. With its shares lagging the market recently, the stock trades at 33× forward P/E (or $65.28 per share). Is now a good time to buy? See for yourself in our full research report, it’s free for active Edge members.
High-Quality Stocks for All Market Conditions
When Trump unveiled his aggressive tariff plan in April 2025, markets tanked as investors feared a full-blown trade war. But those who panicked and sold missed the subsequent rebound that’s already erased most losses.
Don’t let fear keep you from great opportunities and take a look at Top 5 Growth Stocks for this month. This is a curated list of our High Quality stocks that have generated a market-beating return of 183% over the last five years (as of March 31st 2025).
Stocks that made our list in 2020 include now familiar names such as Nvidia (+1,545% between March 2020 and March 2025) as well as under-the-radar businesses like the once-micro-cap company Kadant (+351% five-year return). Find your next big winner with StockStory today.
StockStory is growing and hiring equity analyst and marketing roles. Are you a 0 to 1 builder passionate about the markets and AI? See the open roles here.


