
Over the past six months, Organon’s shares (currently trading at $11.05) have posted a disappointing 11.7% loss, well below the S&P 500’s 32.7% gain. This may have investors wondering how to approach the situation.
Is there a buying opportunity in Organon, or does it present a risk to your portfolio? Check out our in-depth research report to see what our analysts have to say, it’s free for active Edge members.
Why Is Organon Not Exciting?
Even though the stock has become cheaper, we're cautious about Organon. Here are three reasons we avoid OGN and a stock we'd rather own.
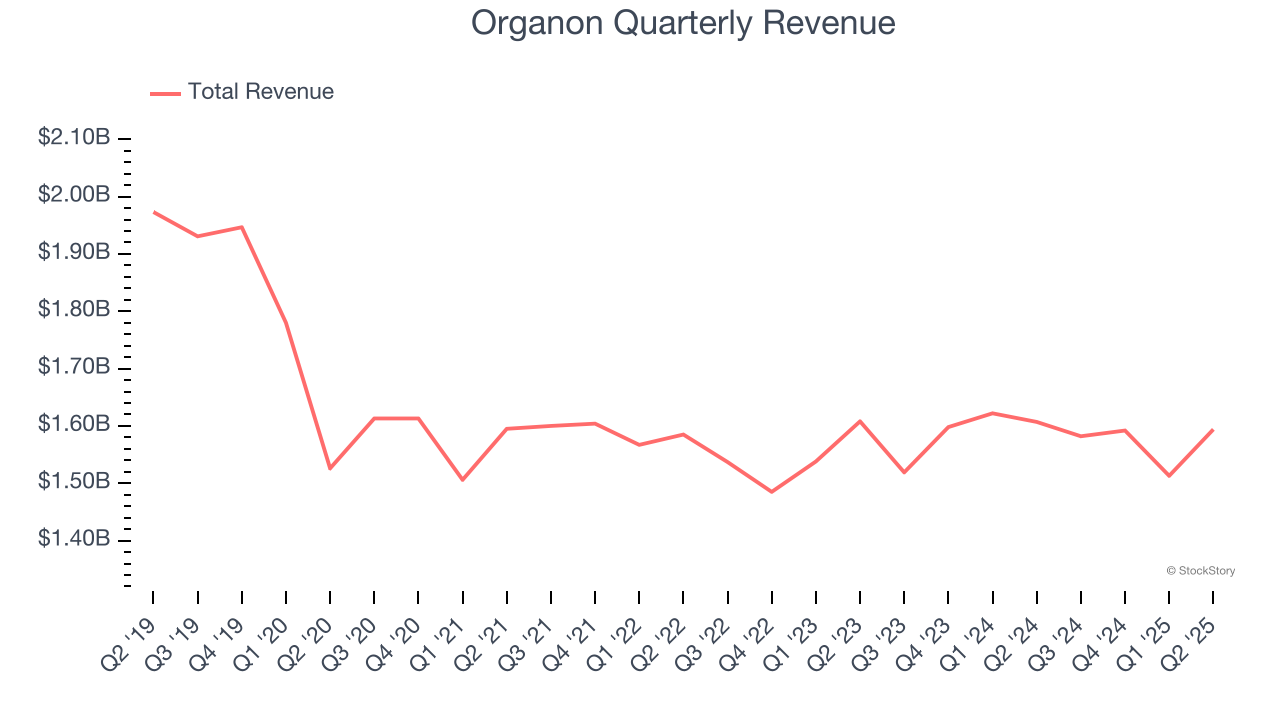
1. Revenue Spiraling Downwards
A company’s long-term sales performance can indicate its overall quality. Even a bad business can shine for one or two quarters, but a top-tier one grows for years. Organon’s demand was weak over the last five years as its sales fell at a 2.6% annual rate. This wasn’t a great result and signals it’s a lower quality business.
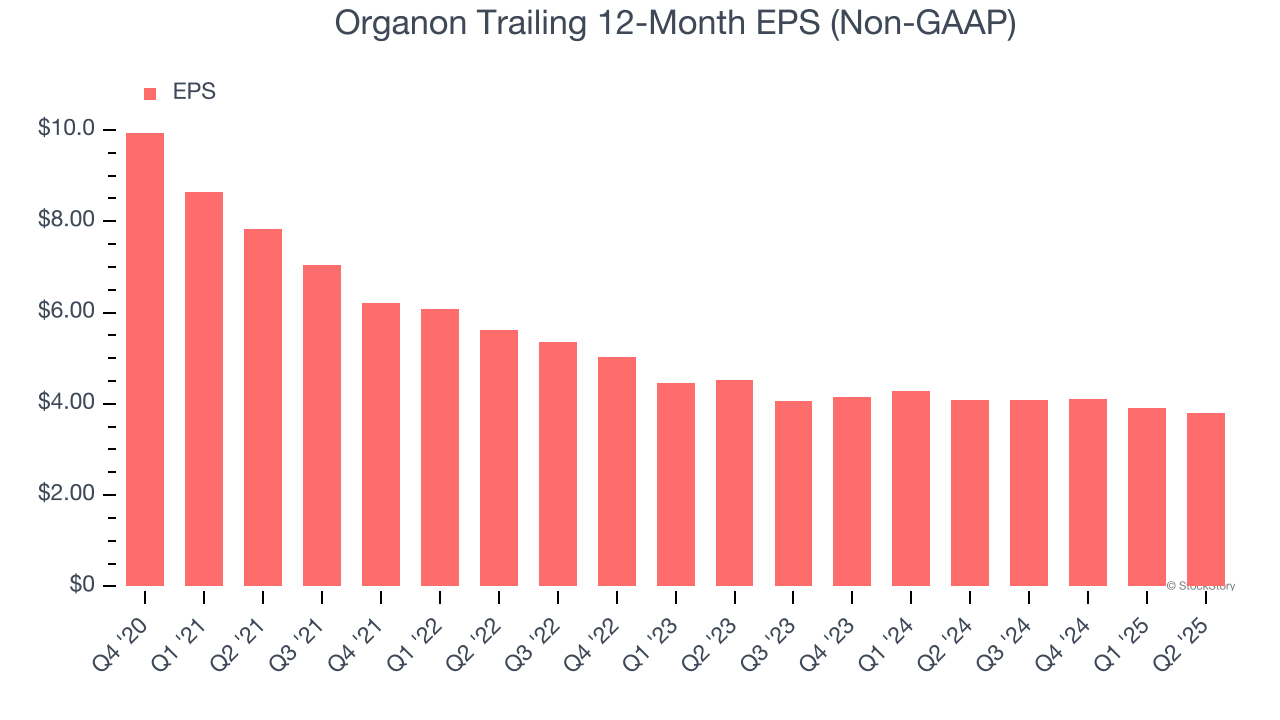
2. EPS Trending Down
We track the long-term change in earnings per share (EPS) because it highlights whether a company’s growth is profitable.
Sadly for Organon, its EPS declined by 18.5% annually over the last five years, more than its revenue. This tells us the company struggled because its fixed cost base made it difficult to adjust to shrinking demand.
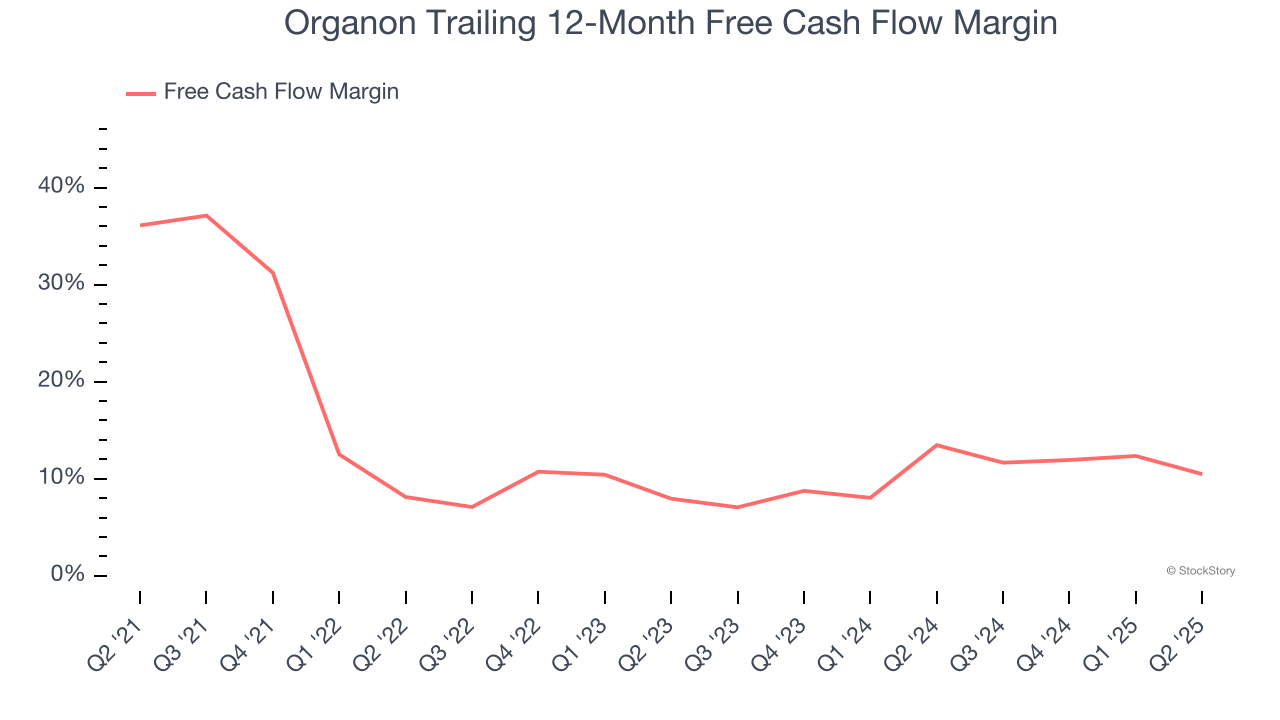
3. Free Cash Flow Margin Dropping
If you’ve followed StockStory for a while, you know we emphasize free cash flow. Why, you ask? We believe that in the end, cash is king, and you can’t use accounting profits to pay the bills.
As you can see below, Organon’s margin dropped by 25.6 percentage points over the last five years. If its declines continue, it could signal increasing investment needs and capital intensity. Organon’s free cash flow margin for the trailing 12 months was 10.5%.
Final Judgment
Organon isn’t a terrible business, but it isn’t one of our picks. After the recent drawdown, the stock trades at 2.8× forward P/E (or $11.05 per share). While this valuation is optically cheap, the potential downside is big given its shaky fundamentals. We're fairly confident there are better investments elsewhere. Let us point you toward one of our top digital advertising picks.
High-Quality Stocks for All Market Conditions
Trump’s April 2025 tariff bombshell triggered a massive market selloff, but stocks have since staged an impressive recovery, leaving those who panic sold on the sidelines.
Take advantage of the rebound by checking out our Top 6 Stocks for this week. This is a curated list of our High Quality stocks that have generated a market-beating return of 183% over the last five years (as of March 31st 2025).
Stocks that made our list in 2020 include now familiar names such as Nvidia (+1,545% between March 2020 and March 2025) as well as under-the-radar businesses like the once-micro-cap company Tecnoglass (+1,754% five-year return). Find your next big winner with StockStory today.
StockStory is growing and hiring equity analyst and marketing roles. Are you a 0 to 1 builder passionate about the markets and AI? See the open roles here.