
Although Prudential (currently trading at $104.02 per share) has gained 8.6% over the last six months, it has trailed the S&P 500’s 32.7% return during that period. This may have investors wondering how to approach the situation.
Is now the time to buy Prudential, or should you be careful about including it in your portfolio? Get the full stock story straight from our expert analysts, it’s free for active Edge members.
Why Do We Think Prudential Will Underperform?
We're sitting this one out for now. Here are three reasons why PRU doesn't excite us and a stock we'd rather own.
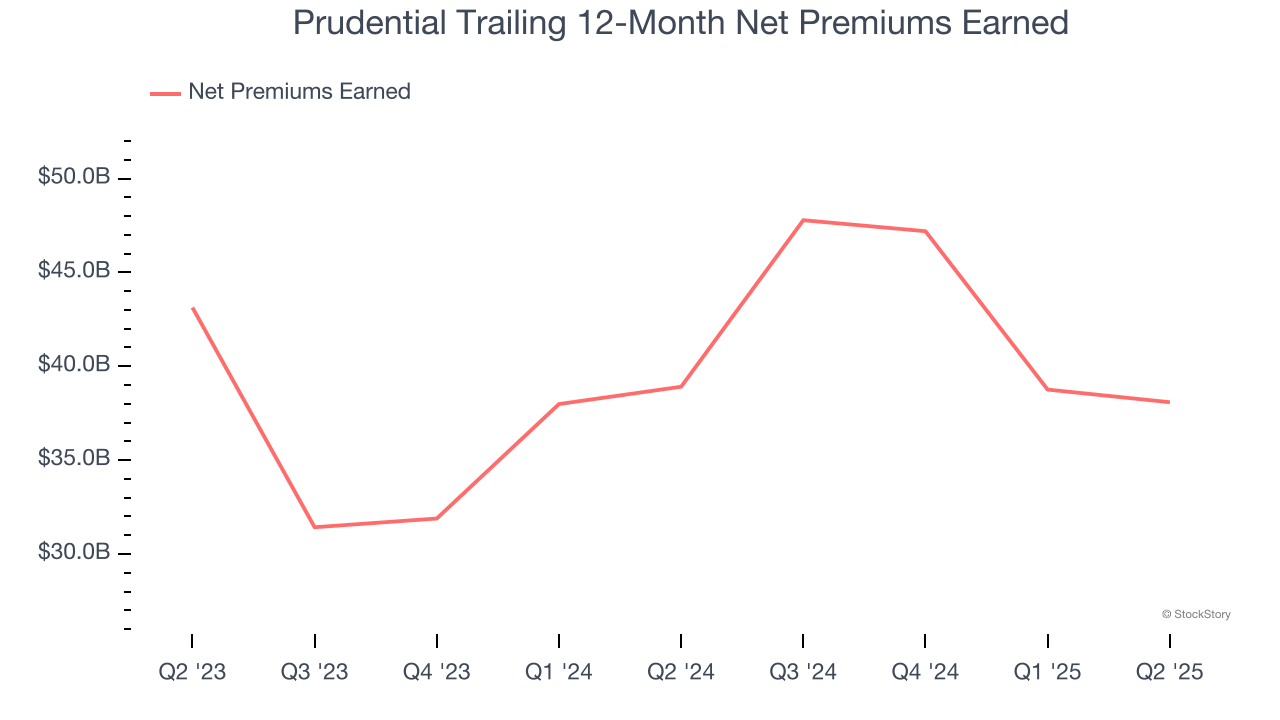
1. Declining Net Premiums Earned Reflect Weakness
Net premiums earned are net of what’s paid to reinsurers (insurance for insurance companies), which are used by insurers to protect themselves from large losses.
Prudential’s net premiums earned has declined by 2.3% annually over the last five years, much worse than the broader insurance industry. This shows that policy underwriting underperformed its other business lines.
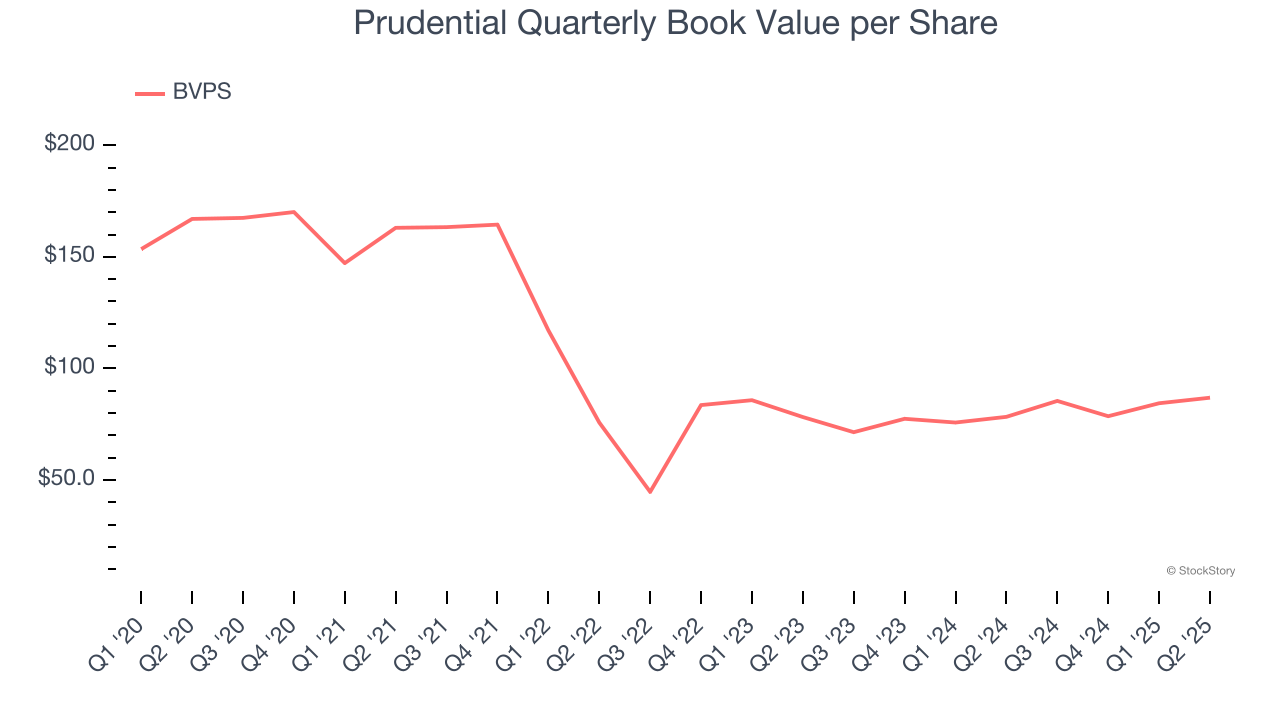
2. Substandard BVPS Growth Indicates Limited Asset Expansion
We consider book value per share (BVPS) a critical metric for insurance companies. BVPS represents the total net worth per share, providing insight into a company’s financial strength and ability to meet policyholder obligations.
Disappointingly for investors, Prudential’s BVPS grew at a sluggish 5.4% annual clip over the last two years.
The debt-to-equity ratio is a widely used measure to assess a company's balance sheet health. A higher ratio means that a business aggressively financed its growth with debt. This can result in higher earnings (if the borrowed funds are invested profitably) but also increases risk.
If debt levels are too high, there could be difficulties in meeting obligations, especially during economic downturns or periods of rising interest rates if the debt has variable-rate payments.
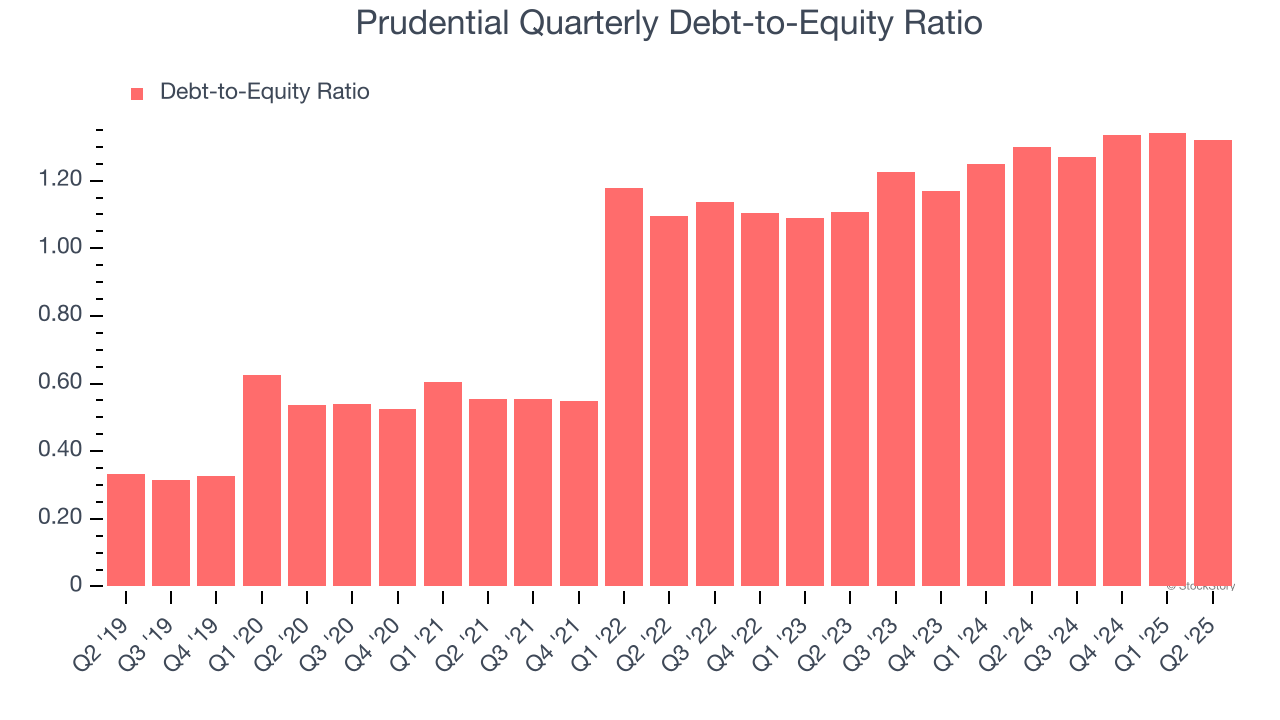
Prudential currently has $40.76 billion of debt and $30.9 billion of shareholder's equity on its balance sheet, and over the past four quarters, has averaged a debt-to-equity ratio of 1.3×. We think this is dangerous - for an insurance business, anything above 1.0× raises red flags.
Final Judgment
Prudential falls short of our quality standards. With its shares lagging the market recently, the stock trades at 1.2× forward P/B (or $104.02 per share). This valuation tells us it’s a bit of a market darling with a lot of good news priced in - we think there are better stocks to buy right now. We’d suggest looking at a top digital advertising platform riding the creator economy.
Stocks We Would Buy Instead of Prudential
Donald Trump’s April 2025 "Liberation Day" tariffs sent markets into a tailspin, but stocks have since rebounded strongly, proving that knee-jerk reactions often create the best buying opportunities.
The smart money is already positioning for the next leg up. Don’t miss out on the recovery - check out our Top 6 Stocks for this week. This is a curated list of our High Quality stocks that have generated a market-beating return of 183% over the last five years (as of March 31st 2025).
Stocks that made our list in 2020 include now familiar names such as Nvidia (+1,545% between March 2020 and March 2025) as well as under-the-radar businesses like the once-micro-cap company Tecnoglass (+1,754% five-year return). Find your next big winner with StockStory today.
StockStory is growing and hiring equity analyst and marketing roles. Are you a 0 to 1 builder passionate about the markets and AI? See the open roles here.